Fig. 3
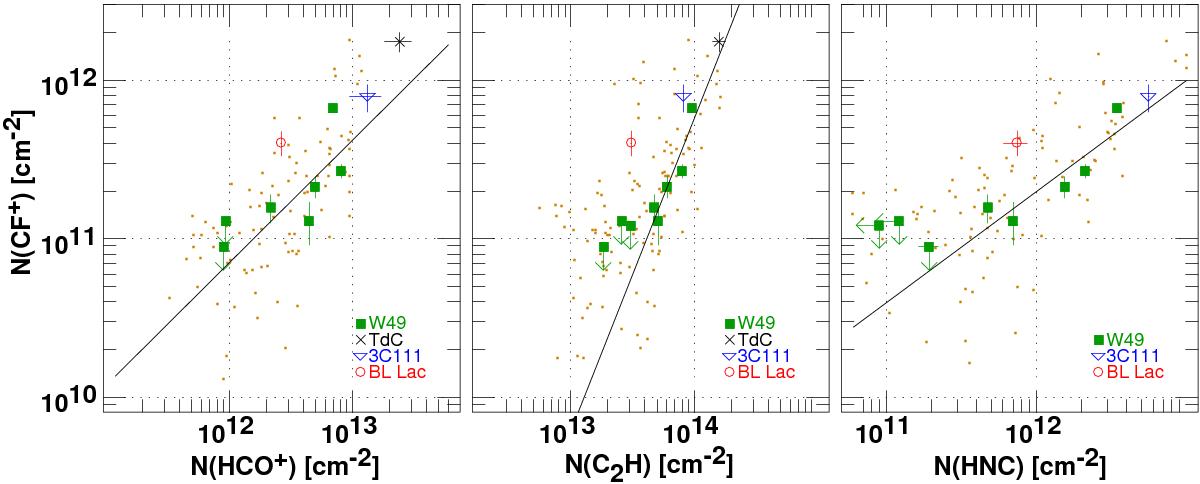
Column density of CF+ vs. those of HCO+ (left), C2H (middle) and HNC (right) for the velocity intervals in Tables 2 and 4. Shown for comparison are data from diffuse cloud sightlines toward BL Lac and 3C 111, and for the Horsehead (TdC). The small brown points are the individual channel values of optical depth in the original spectra, scaled equally in each coordinate to fit in the plot area. Upper limits are 3σ. The solid lines are regression lines fit to the detections toward W49, ignoring the upper limits.
Current usage metrics show cumulative count of Article Views (full-text article views including HTML views, PDF and ePub downloads, according to the available data) and Abstracts Views on Vision4Press platform.
Data correspond to usage on the plateform after 2015. The current usage metrics is available 48-96 hours after online publication and is updated daily on week days.
Initial download of the metrics may take a while.