Fig. 2
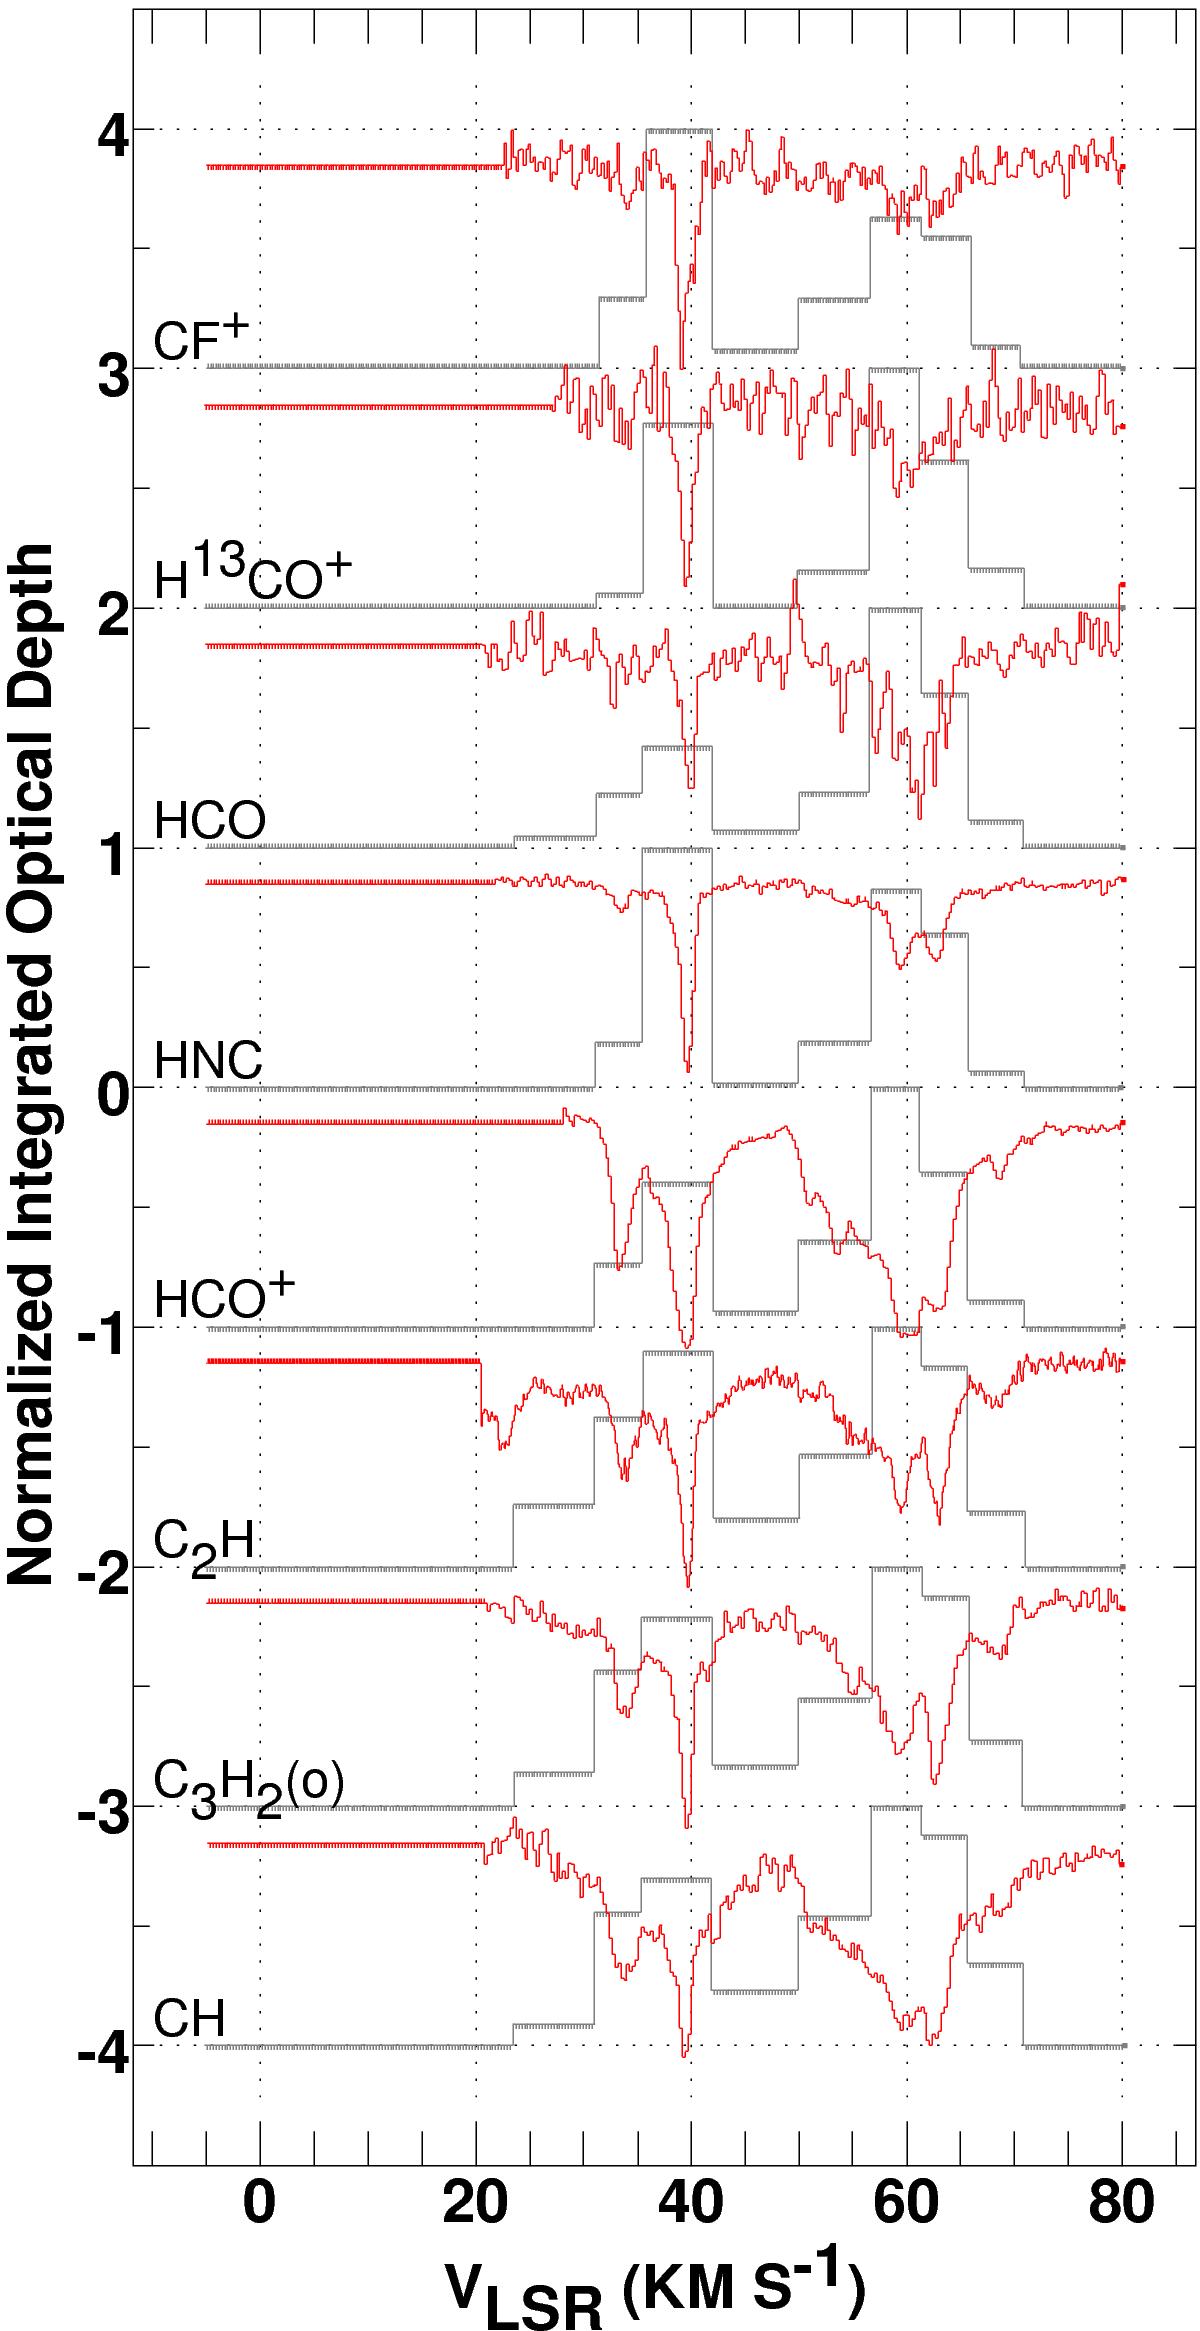
Histograms of integrated optical depth over discrete velocity ranges for species observed in absorption toward W49N, normalized to a maximum of unity in each case. The quantities plotted are those given in Table 2. Scaled and offset absorption spectra are shown superposed in red to illustrate the underlying kinematic features in the velocity bins.
Current usage metrics show cumulative count of Article Views (full-text article views including HTML views, PDF and ePub downloads, according to the available data) and Abstracts Views on Vision4Press platform.
Data correspond to usage on the plateform after 2015. The current usage metrics is available 48-96 hours after online publication and is updated daily on week days.
Initial download of the metrics may take a while.