Fig. 1
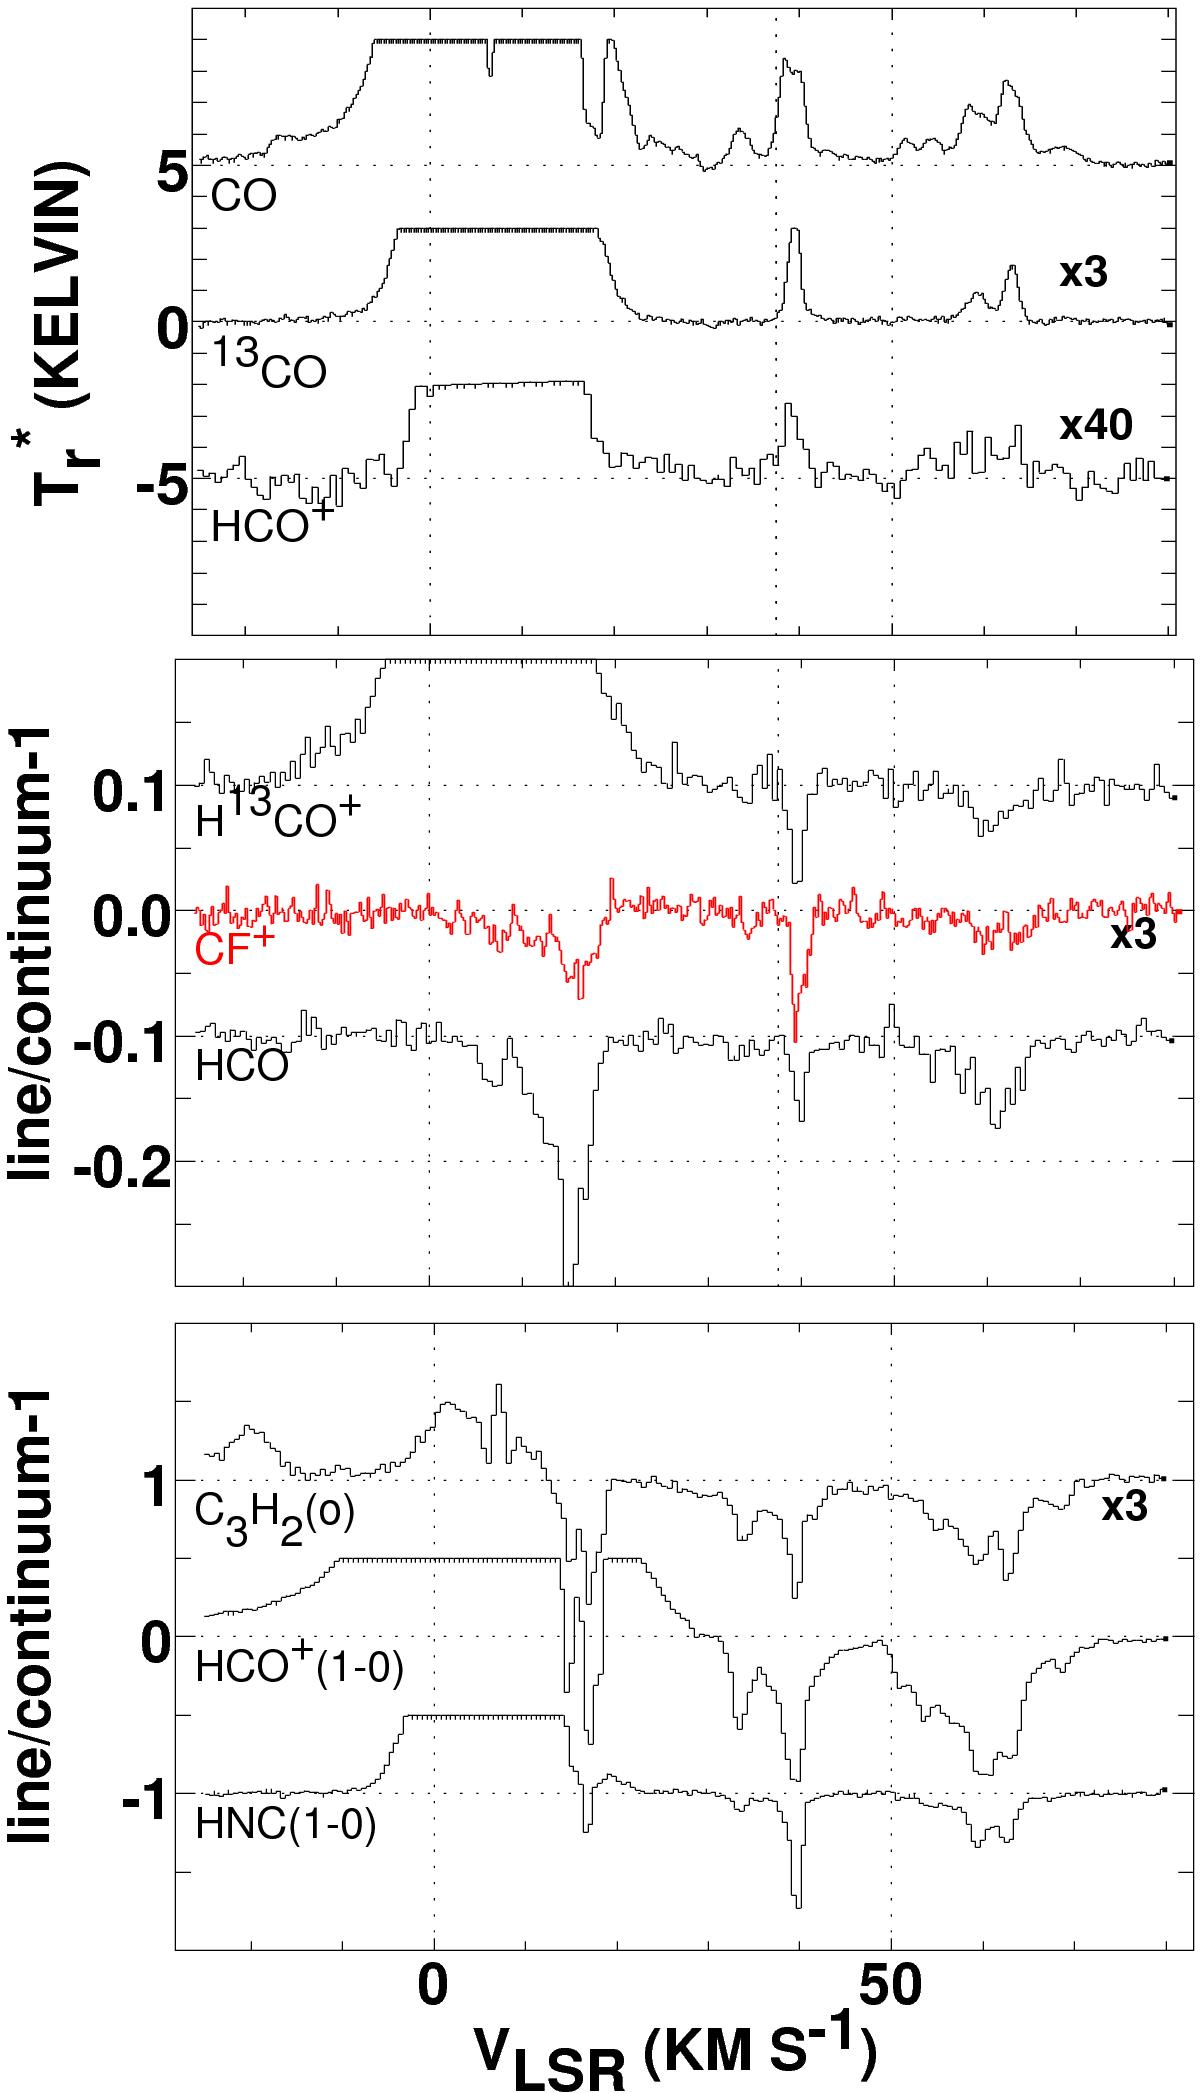
Line profiles observed toward W49N. Top: emission spectra from the ARO 12 m antenna at ≈1′ spatial resolution. Brighter emission below 20 km s-1 from the W49N H II region-molecular cloud complex has been truncated to allow better viewing of weaker emission from the Galactic plane clouds. Middle: absorption from weaker-lined transitions including CF+ studied at the PdBI. Bottom: absorption in stronger and more ubiquitously distributed species observed at the 30 m. The absorption data are plotted as line/continuum ratios, displaced as needed to fit the plot. In some cases the profiles have been scaled to make weak features more easily visible, with a scale factor as shown at the right hand side of the spectrum.
Current usage metrics show cumulative count of Article Views (full-text article views including HTML views, PDF and ePub downloads, according to the available data) and Abstracts Views on Vision4Press platform.
Data correspond to usage on the plateform after 2015. The current usage metrics is available 48-96 hours after online publication and is updated daily on week days.
Initial download of the metrics may take a while.