Fig. 2
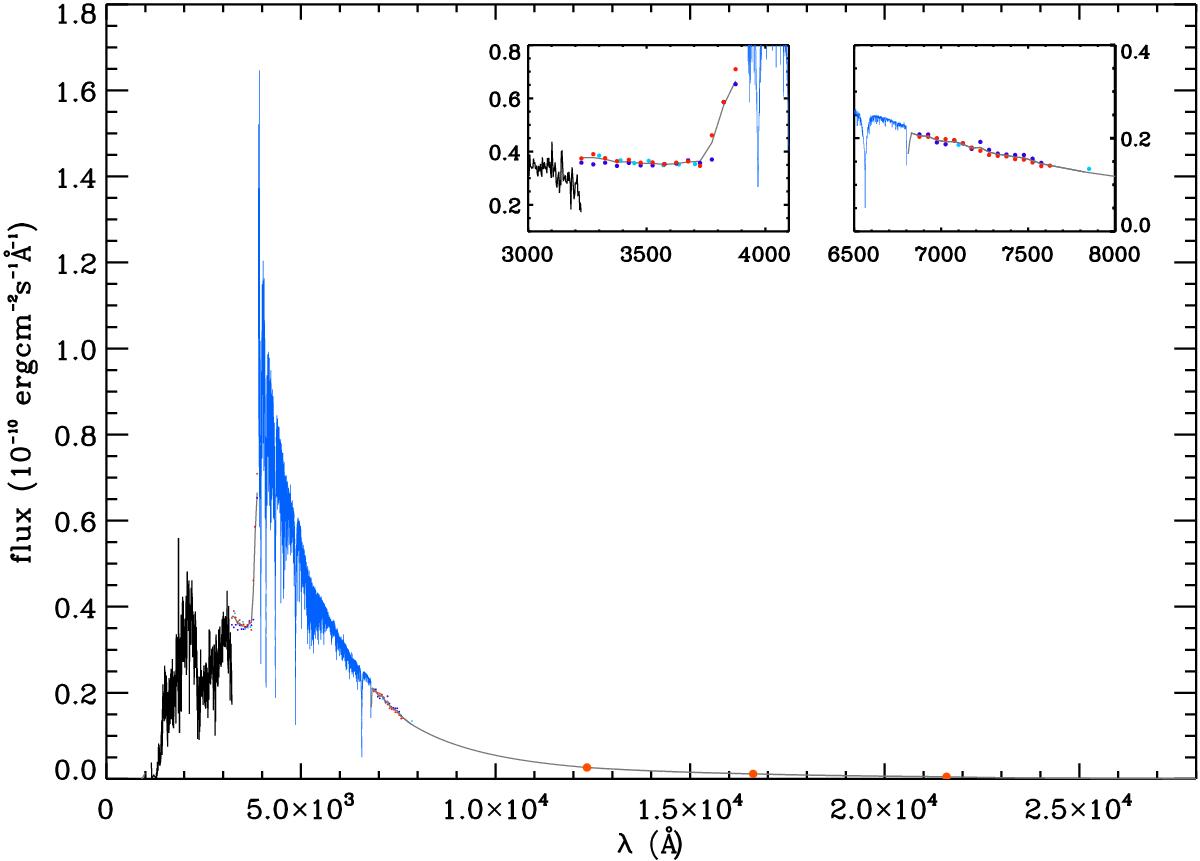
Spectral energy distribution obtained for 78 Vir. The IUE spectrum is shown in black at the lower wavelengths, the ELODIE spectrum is shown in blue, the interpolations are shown in gray and the 2MASS data are shown by orange circles. Spectrophotometric data are shown by blue (Kharitonov et al. 1988), cyan (Adelman et al. 1989), and red (Glushneva et al. 1998) dots. Insets at the top are zooms for two different spectral ranges. (See online edition for a color version.)
Current usage metrics show cumulative count of Article Views (full-text article views including HTML views, PDF and ePub downloads, according to the available data) and Abstracts Views on Vision4Press platform.
Data correspond to usage on the plateform after 2015. The current usage metrics is available 48-96 hours after online publication and is updated daily on week days.
Initial download of the metrics may take a while.