Fig. 5
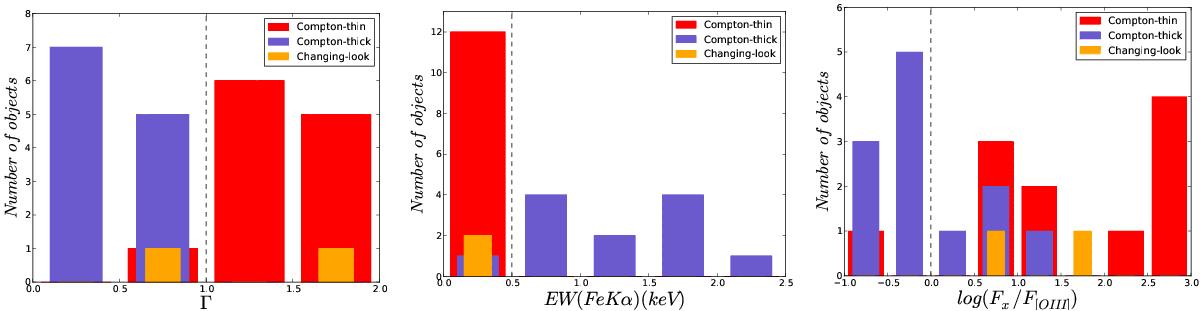
Histograms of left: the slope of the power law, Γ from Table A.7; middle: equivalent width of the iron line, EW(FeKα); and right: the X-ray to [O III] flux ratios. In all cases the sample is divided into Compton-thick (purple), Compton-thin (red), and changing-look (orange) candidates. The dashed lines represents the values for the selection of Compton-thick (below) and Compton-thin (above) candidates.
Current usage metrics show cumulative count of Article Views (full-text article views including HTML views, PDF and ePub downloads, according to the available data) and Abstracts Views on Vision4Press platform.
Data correspond to usage on the plateform after 2015. The current usage metrics is available 48-96 hours after online publication and is updated daily on week days.
Initial download of the metrics may take a while.