Fig. 4
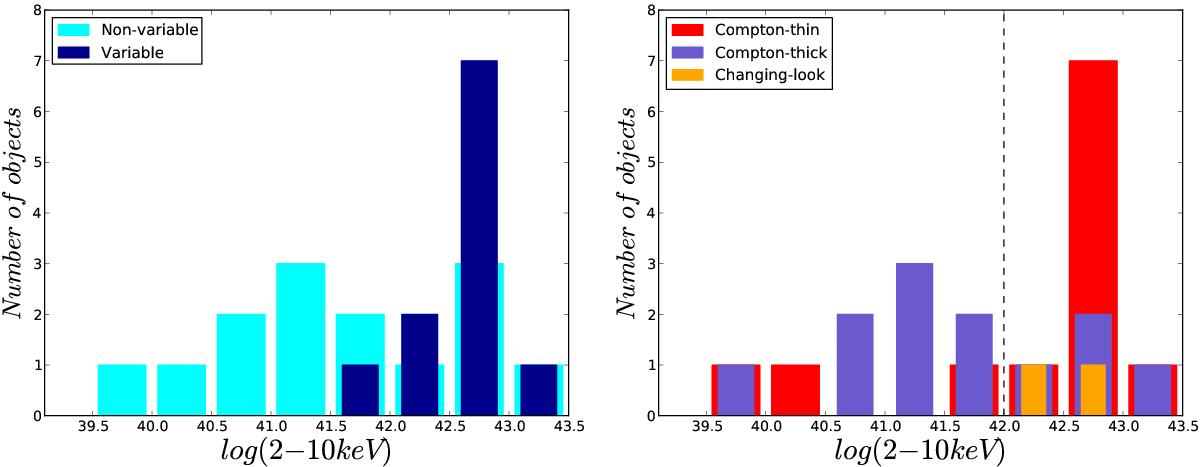
Histograms of: left: the luminosities for the variable (dark blue) and non-variable (light blue) galaxies in the sample; and right: the luminosities for the galaxies in the sample divided into Compton-thick (purple), Compton-thin (red), and changing-look (orange) candidates. The dashed line represents the value for the selection of faint (below) and bright (above) Seyfert 2s.
Current usage metrics show cumulative count of Article Views (full-text article views including HTML views, PDF and ePub downloads, according to the available data) and Abstracts Views on Vision4Press platform.
Data correspond to usage on the plateform after 2015. The current usage metrics is available 48-96 hours after online publication and is updated daily on week days.
Initial download of the metrics may take a while.