Free Access
Fig. 9
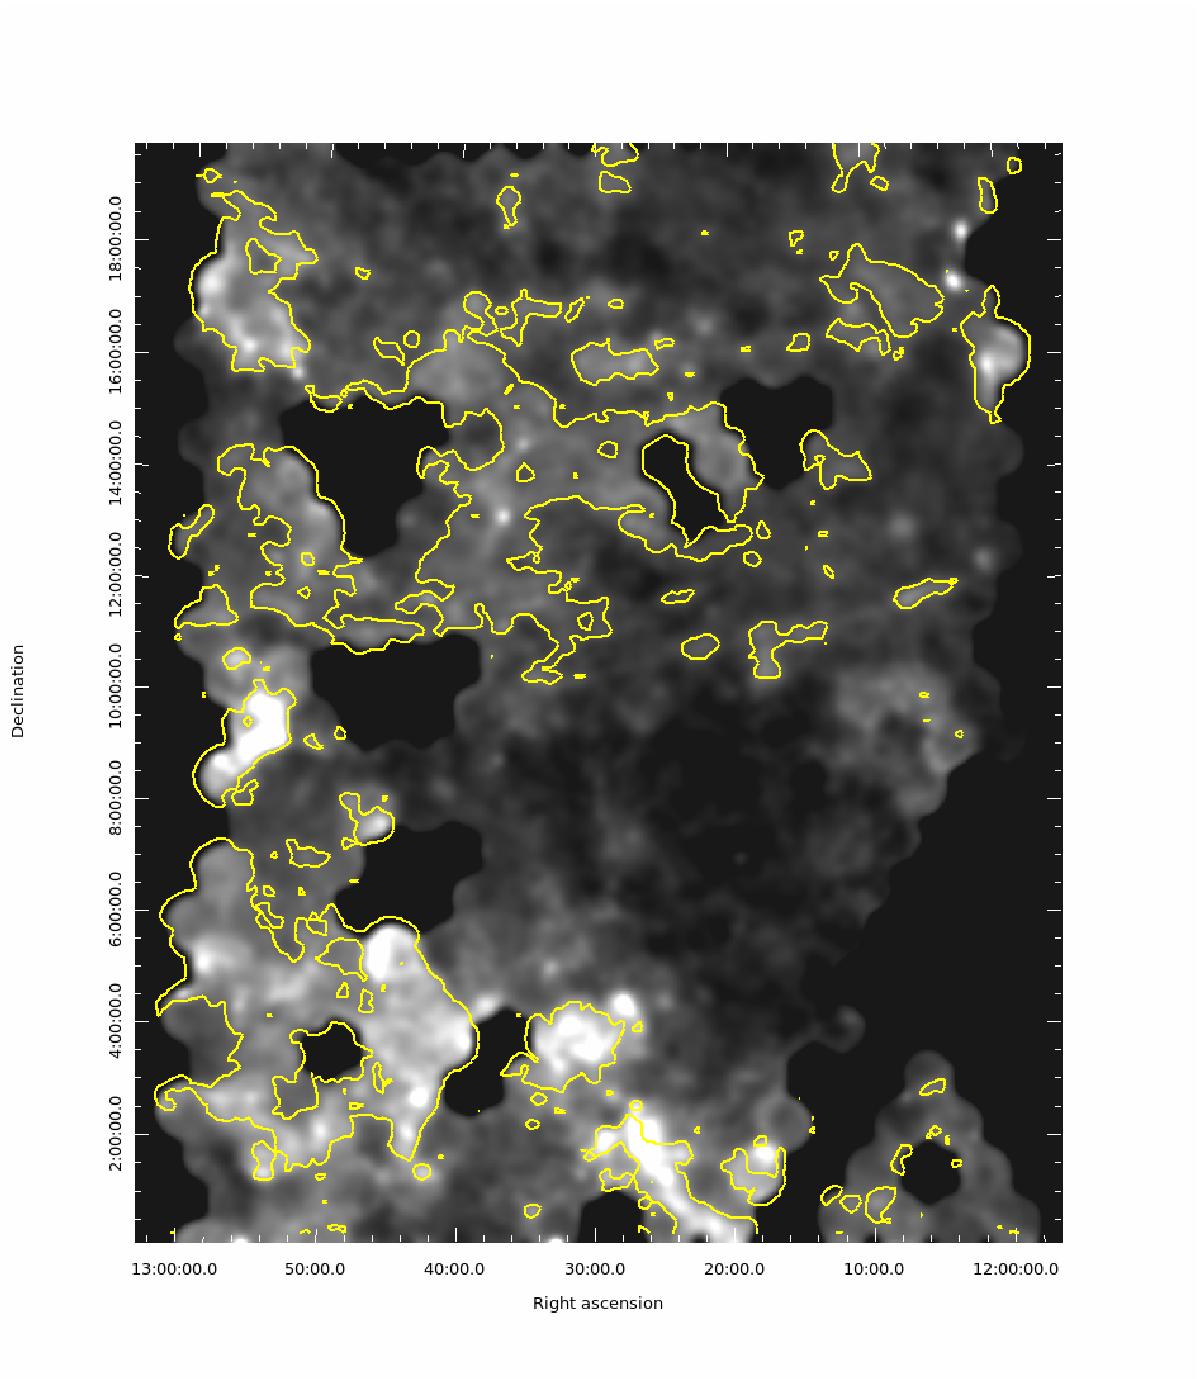
Ratio of the FUV diffuse emission (in the 1 arcmin pixel map) to the 100 micron emission, after applying a Gaussian filter of 6 arcmin to both images. The contours roughly indicate the regions in which the cirrus emission is found (Sect. 3.2).
Current usage metrics show cumulative count of Article Views (full-text article views including HTML views, PDF and ePub downloads, according to the available data) and Abstracts Views on Vision4Press platform.
Data correspond to usage on the plateform after 2015. The current usage metrics is available 48-96 hours after online publication and is updated daily on week days.
Initial download of the metrics may take a while.