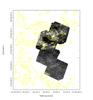
Fig. 4
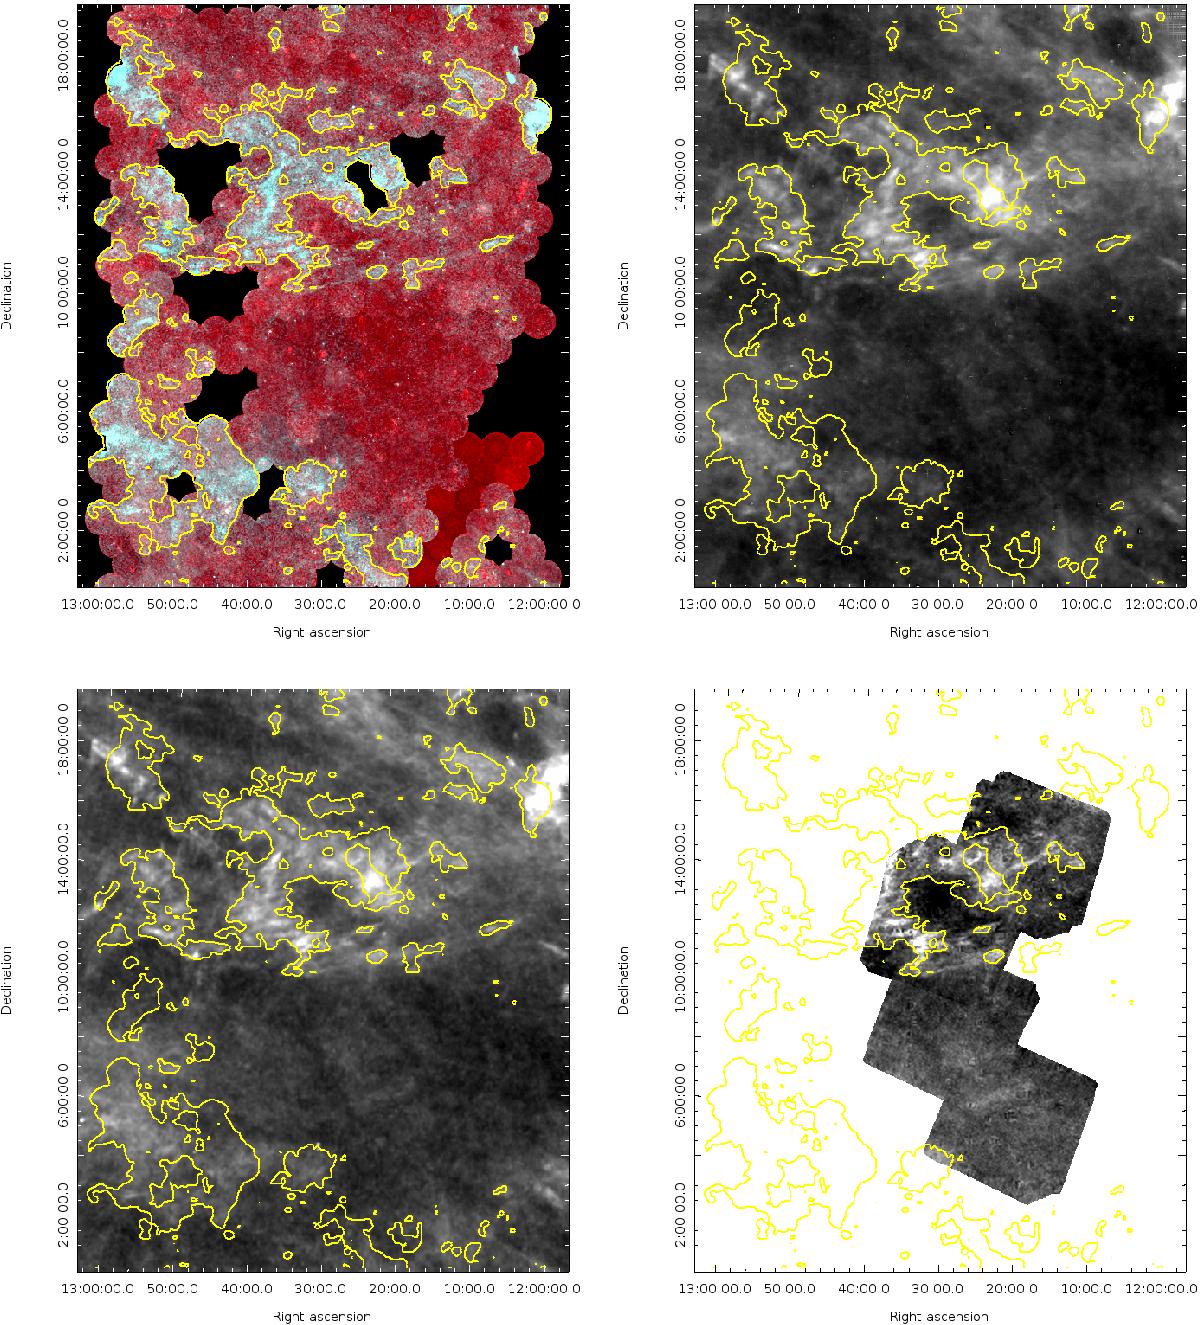
Gallery of multi-wavelength tracers of the cirrus in the Virgo Area. Top left: composition of FUV (blue) and NUV (red) mosaics from GUViCS. Bottom left: Planck E(B−V) map. Top right: 100 microns IRIS map. Bottom right: 250 microns HeViCS map. The yellow contours are the broadly defined regions of cirrus detected in FUV (Sect. 3.2).
Current usage metrics show cumulative count of Article Views (full-text article views including HTML views, PDF and ePub downloads, according to the available data) and Abstracts Views on Vision4Press platform.
Data correspond to usage on the plateform after 2015. The current usage metrics is available 48-96 hours after online publication and is updated daily on week days.
Initial download of the metrics may take a while.