Fig. 3
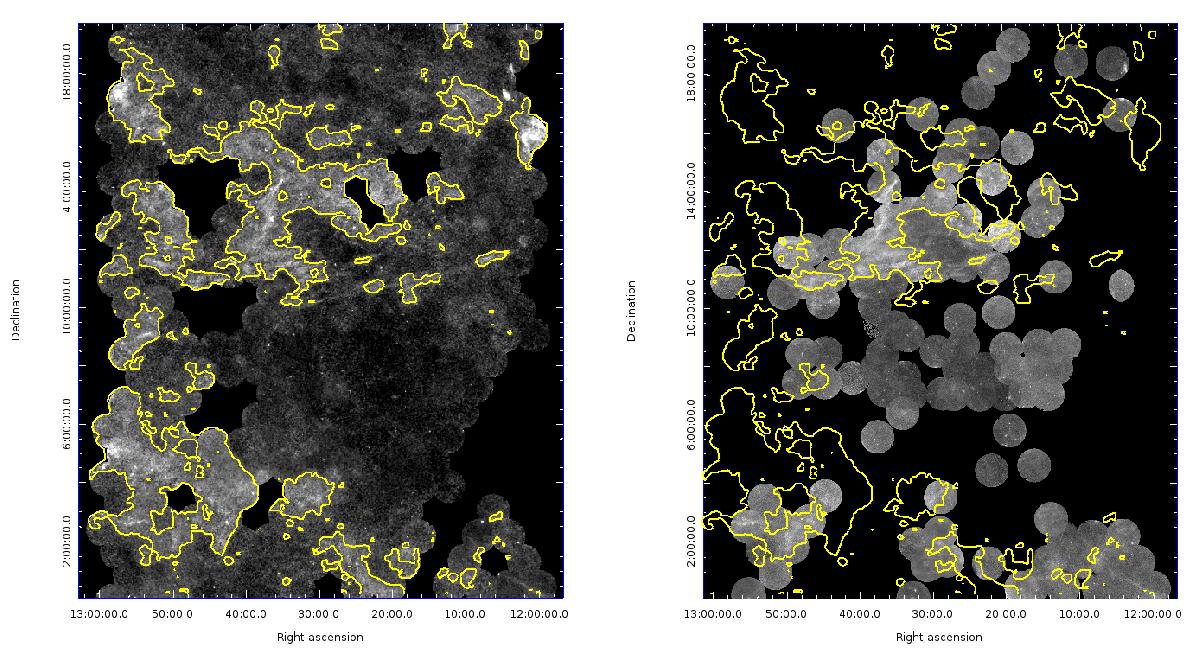
Left: mosaic showing the diffuse FUV emission obtained from AIS data (1 arcmin pixels, median smoothed on 3 × 3 pixels). Right: diffuse FUV emission obtained on the basis of deeper data (on 20 arcsec pixels, median smoothed on 3 × 3 pixels). The contours indicate roughly the regions in which the cirrus emission is found (Sect. 3.2).
Current usage metrics show cumulative count of Article Views (full-text article views including HTML views, PDF and ePub downloads, according to the available data) and Abstracts Views on Vision4Press platform.
Data correspond to usage on the plateform after 2015. The current usage metrics is available 48-96 hours after online publication and is updated daily on week days.
Initial download of the metrics may take a while.