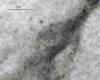
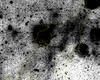
Fig. 12
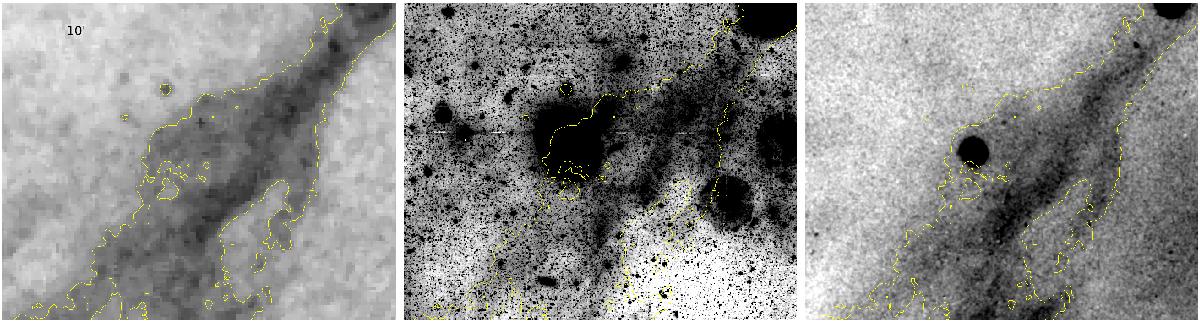
Region around coordinates RA = 12:36:07.201, Dec = +14:16:39.98 is shown as seen in the 20 arcsec pixels FUV diffuse light map (left), in the NGVS (Ferrarese et al. 2012) g band image (middle), and in the WISE W3 diffuse emission (right) from Meisner & Finkbeiner (2014) on the same scale. To ease the comparison, a single contour was computed in FUV and overlaid on the other images.
Current usage metrics show cumulative count of Article Views (full-text article views including HTML views, PDF and ePub downloads, according to the available data) and Abstracts Views on Vision4Press platform.
Data correspond to usage on the plateform after 2015. The current usage metrics is available 48-96 hours after online publication and is updated daily on week days.
Initial download of the metrics may take a while.