Fig. 11
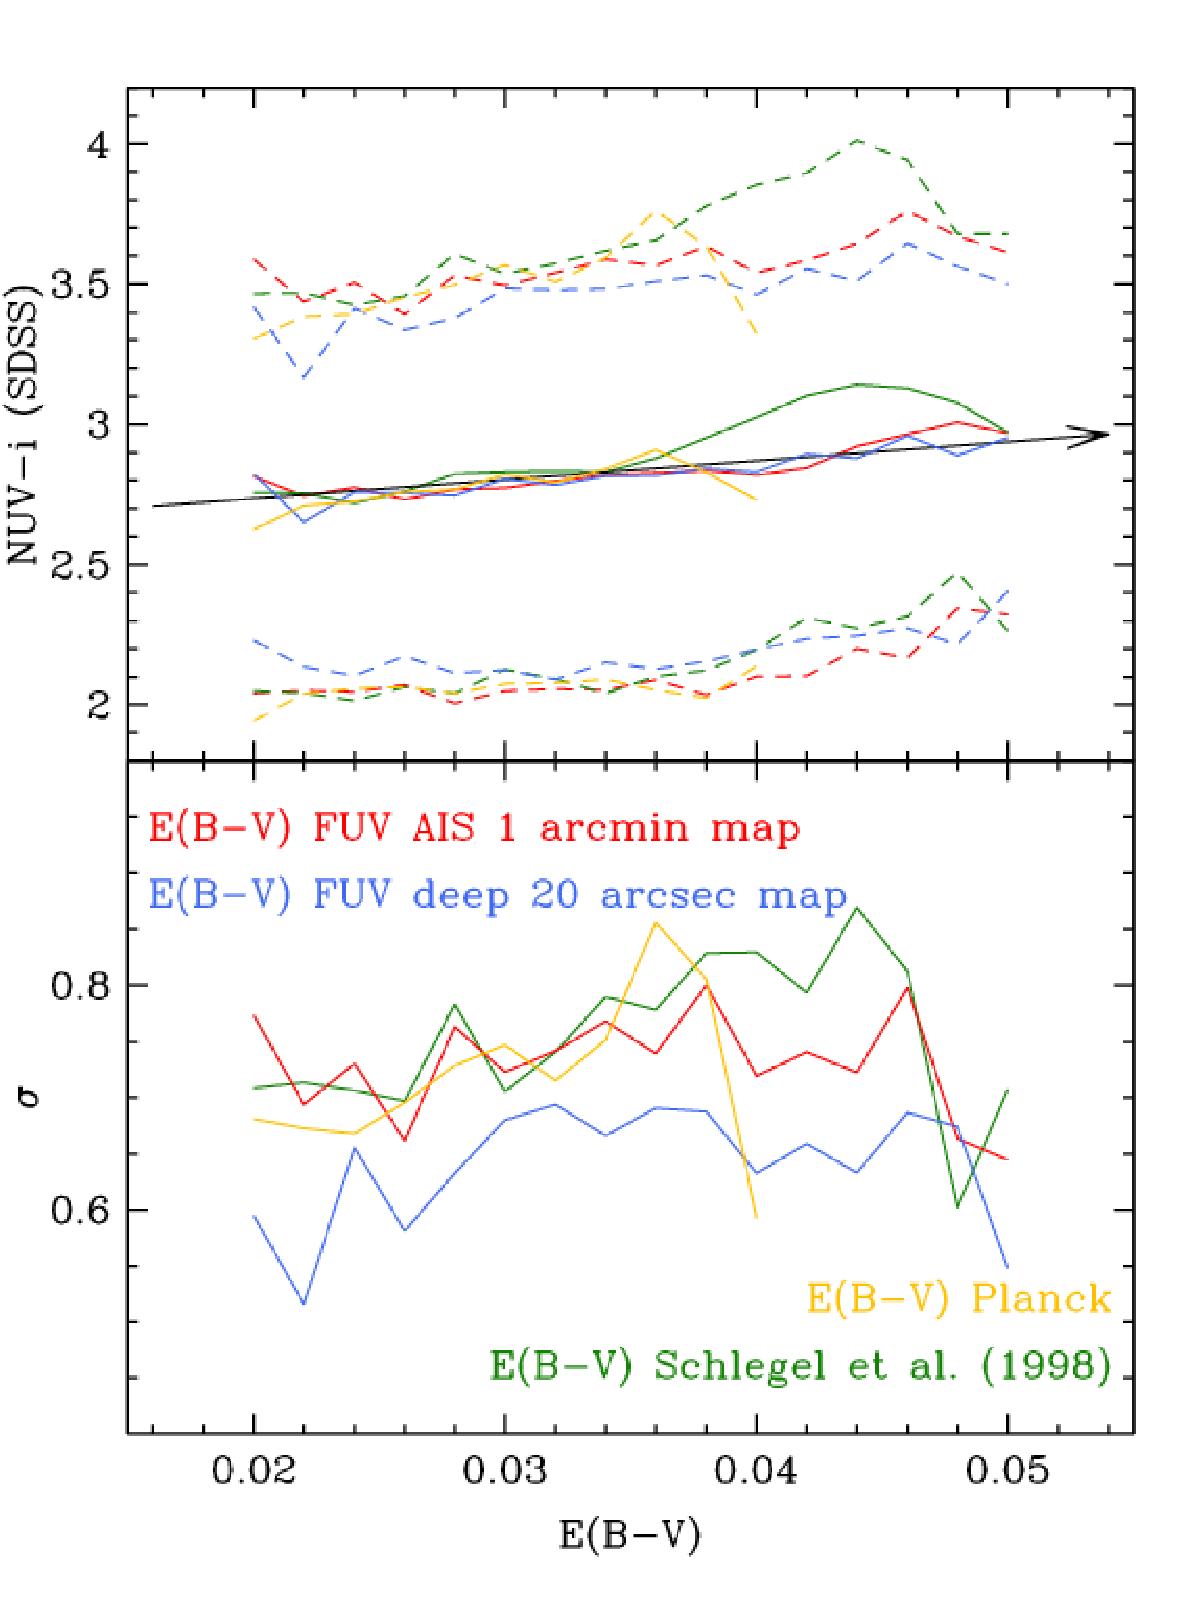
Top: NUV−i colour of SDSS galaxies in the Voyer et al. (2014) catalogue as a function of the Galactic dust reddening (taking only objects with signal-to-noise higher than 10). The solid lines show the average, while the dashed lines indicate the 1-sigma dispersion. The dust reddening is derived either from the Schlegel maps (as given in the GUViCS catalogue), from the Planck E(B−V) map, or from our FUV 1 arcmin or 20 arcsec resolution diffuse emission maps. The arrow indicates the expected reddening trend (see Sect. 3.6). Bottom: the 1-sigma dispersion of the NUV−i colour is indicated as a function of the reddening. The range plotted in both panels corresponds to the bins where we do obtain E(B−V) values for each method.
Current usage metrics show cumulative count of Article Views (full-text article views including HTML views, PDF and ePub downloads, according to the available data) and Abstracts Views on Vision4Press platform.
Data correspond to usage on the plateform after 2015. The current usage metrics is available 48-96 hours after online publication and is updated daily on week days.
Initial download of the metrics may take a while.