Free Access
Fig. 10
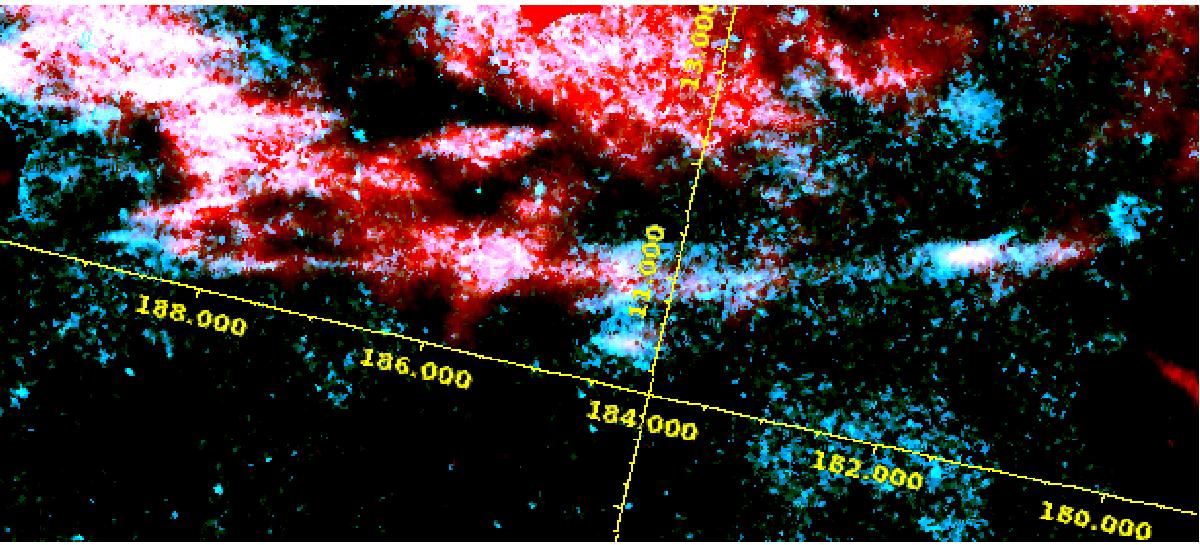
Combination of the FUV emission (blue) and 100 micron emission (red) along an extended cirrus feature, spreading from the left to the right of the figure. The scaling was chosen to show the complementarity of the two dust tracers, since the colour is changing along the structure.
Current usage metrics show cumulative count of Article Views (full-text article views including HTML views, PDF and ePub downloads, according to the available data) and Abstracts Views on Vision4Press platform.
Data correspond to usage on the plateform after 2015. The current usage metrics is available 48-96 hours after online publication and is updated daily on week days.
Initial download of the metrics may take a while.