Fig. 8
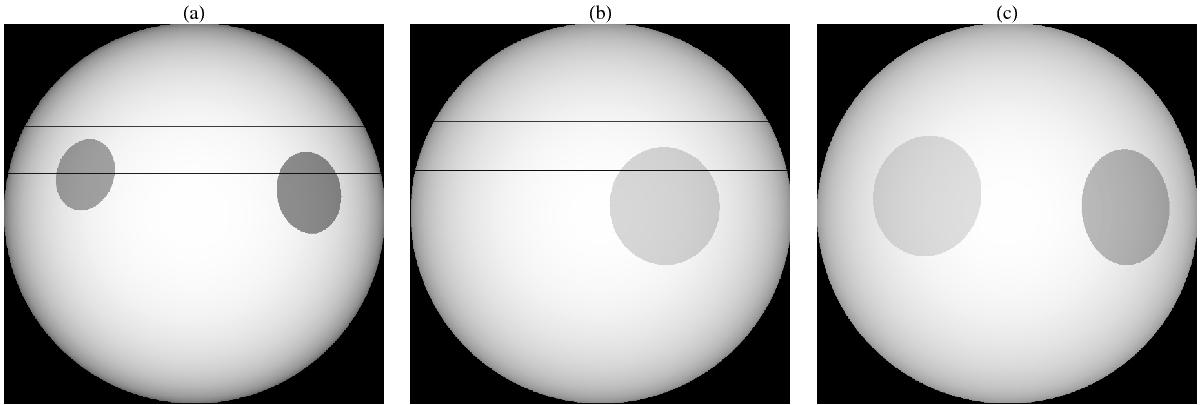
Representation of the stellar disc, starspot positions, and transit chord for the three HAT-P-36 datasets containing spot anomalies: a) refers to the transit observed with the Cassini 1.52 m telescope on 2013 April 15, and b) and c) to those observed with the CA 1.23 m telescope on 2014 April 14 and 18, respectively. The grey scale of each starspot is related to its contrast (compare with values in Table 4).
Current usage metrics show cumulative count of Article Views (full-text article views including HTML views, PDF and ePub downloads, according to the available data) and Abstracts Views on Vision4Press platform.
Data correspond to usage on the plateform after 2015. The current usage metrics is available 48-96 hours after online publication and is updated daily on week days.
Initial download of the metrics may take a while.