Fig. 5
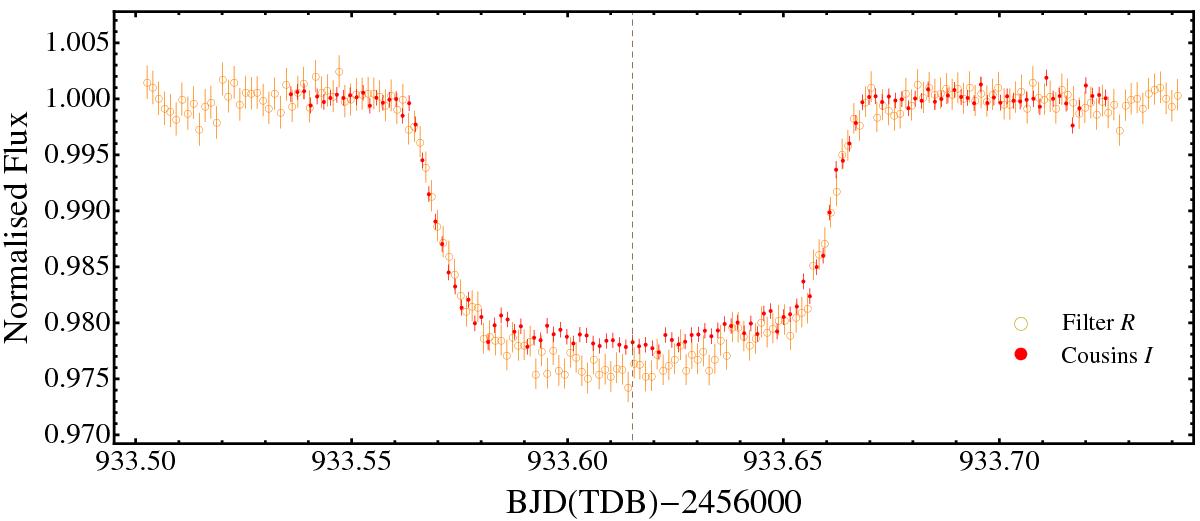
Light curve of a transit event of WASP-11/HAT-P-10 b observed simultaneously with the CA 1.23 m (red points) and the IAC 80 cm (empty orange circles) telescopes. The data of the two telescopes are superimposed to highlight the difference in the light-curve shape caused by the different filter adopted (Knutson et al. 2007). The dashed vertical line represents the time of transit mid-point that, thanks to the two-site strategy, was very accurately measured.
Current usage metrics show cumulative count of Article Views (full-text article views including HTML views, PDF and ePub downloads, according to the available data) and Abstracts Views on Vision4Press platform.
Data correspond to usage on the plateform after 2015. The current usage metrics is available 48-96 hours after online publication and is updated daily on week days.
Initial download of the metrics may take a while.