Fig. 4
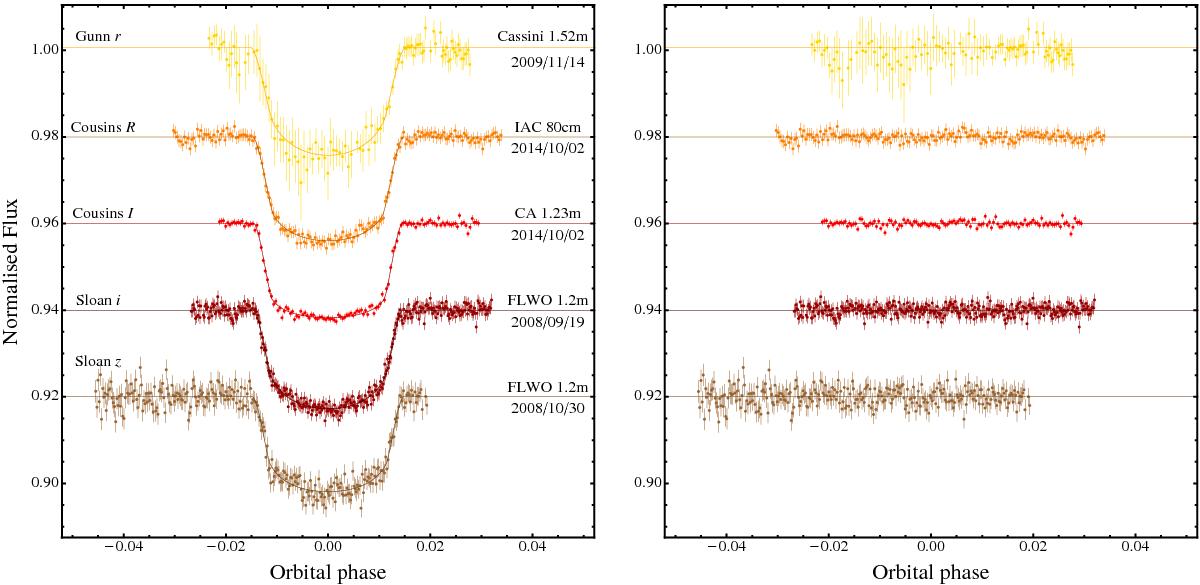
Light curves of WASP-11/HAT-P-10 b transits compared with the best jktebop fits. The dates, the telescopes, and the filters used for each transit event are indicated. Residuals from the fits are displayed in the right panel. Starting from the top, the first three light curves are from this work, whereas the last two are from Bakos et al. (2009). The second and third light curves are related to the same transit event.
Current usage metrics show cumulative count of Article Views (full-text article views including HTML views, PDF and ePub downloads, according to the available data) and Abstracts Views on Vision4Press platform.
Data correspond to usage on the plateform after 2015. The current usage metrics is available 48-96 hours after online publication and is updated daily on week days.
Initial download of the metrics may take a while.