Free Access
Fig. 1
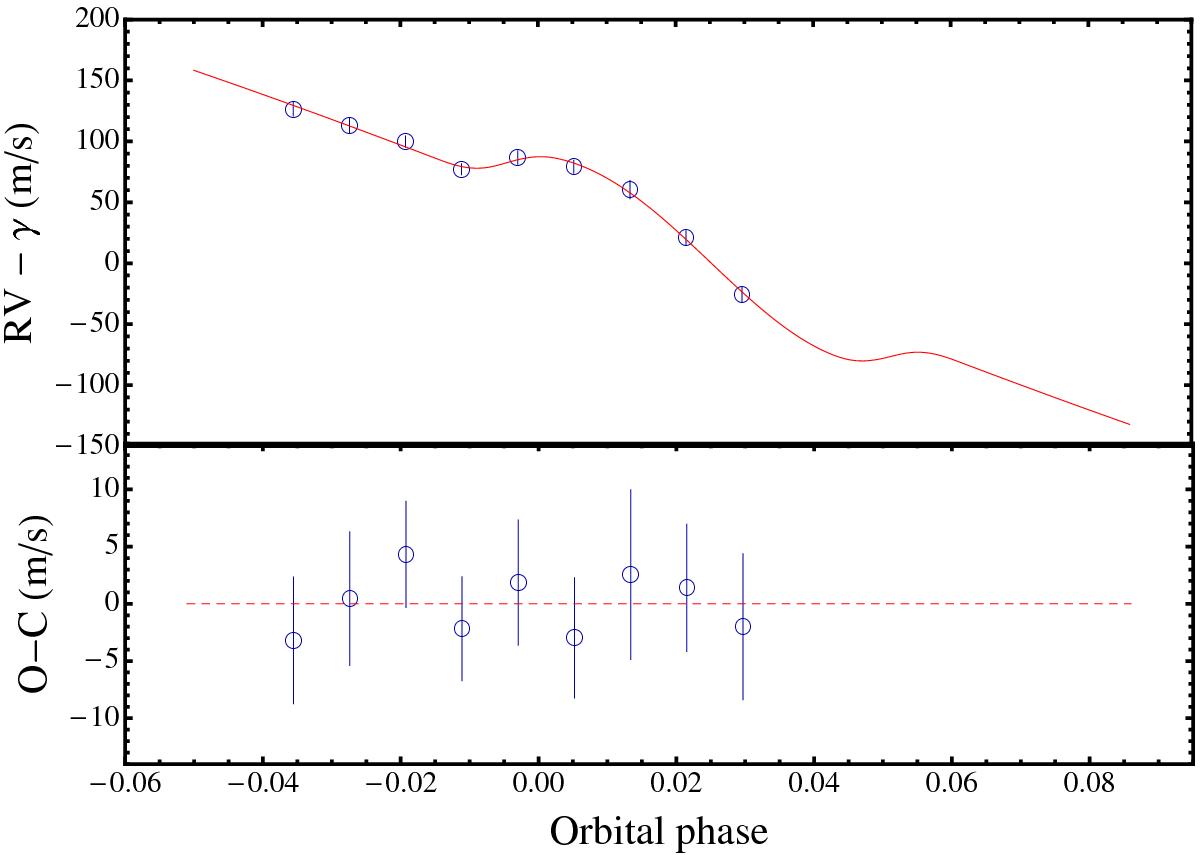
Phase-folded RV data of a partial transit of HAT-P-36 b observed with HARPS-N. Superimposed is the best-fitting RV-curve model. The corresponding residuals are plotted in the lower panel. Phase 0 corresponds to the time of the planet passing the periastron.
Current usage metrics show cumulative count of Article Views (full-text article views including HTML views, PDF and ePub downloads, according to the available data) and Abstracts Views on Vision4Press platform.
Data correspond to usage on the plateform after 2015. The current usage metrics is available 48-96 hours after online publication and is updated daily on week days.
Initial download of the metrics may take a while.