Fig. 9
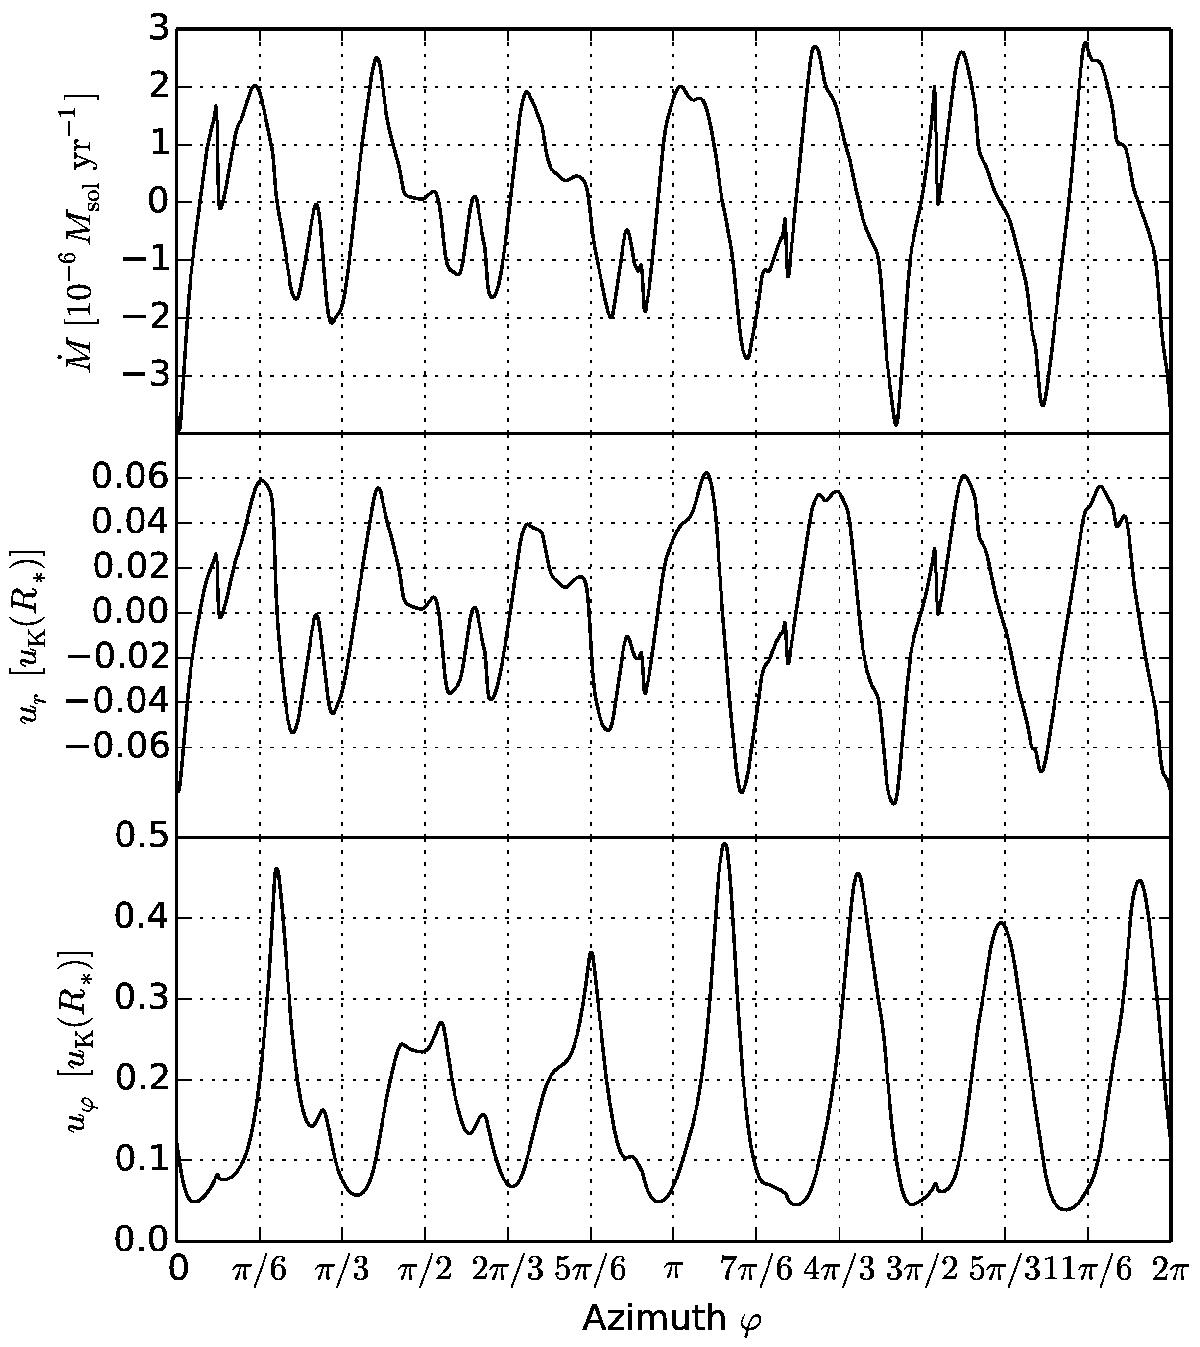
Upper panel: mass accretion rate; middle panel: radial velocity; and lower panel: azimuthal velocity. All three quantities are plotted as functions of azimuth at the fixed radius r = 1.12R∗ after 145 orbits. The upper two curves are shifted in phase with respect to the lower one such that maxima in Ṁ (nearly) coincide with minima in uϕ.
Current usage metrics show cumulative count of Article Views (full-text article views including HTML views, PDF and ePub downloads, according to the available data) and Abstracts Views on Vision4Press platform.
Data correspond to usage on the plateform after 2015. The current usage metrics is available 48-96 hours after online publication and is updated daily on week days.
Initial download of the metrics may take a while.