Fig. 7
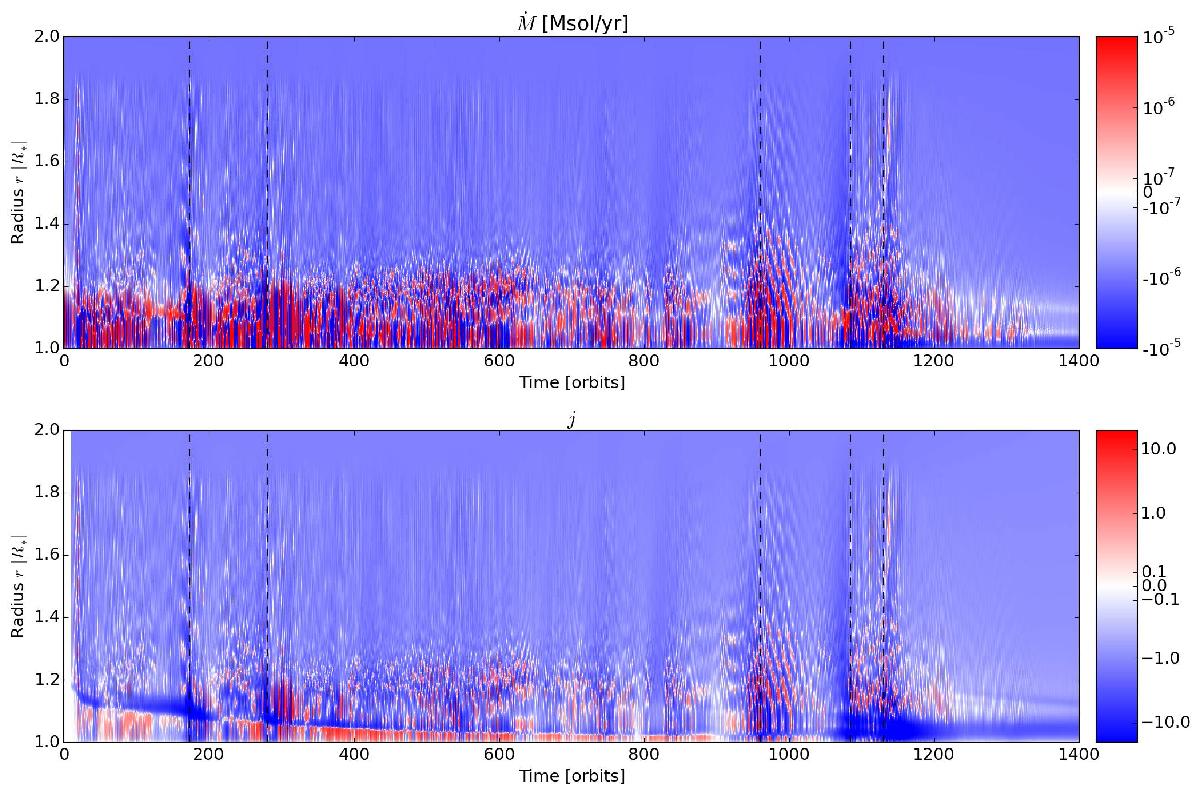
Upper panel: temporal evolution of the mass accretion rate in the radial direction, Ṁ(r,t), in units of solar masses per year. It is obtained from the mass accretion rate per cell (see Eq. (16)) by integrating over the azimuthal direction. Lower panel: visualization of the AM flux normalized to the advective AM flux at the stellar surface (see Eq. (18)), which is also integrated over azimuth. We note that we applied a so-called symlog scaling for the plot, which means that we have a logarithmic scaling for both the positive and the negative values. Only in the vicinity of 0 is the scale linear. A negative value means that mass or AM is transported to the center of the disk. The phases of strong activity in the radial velocity (see Fig. 6, marked with the black dashed lines here) correspond to phases of increased mass and AM transport. The diagonal features in the upper panel are a clear signature of waves, which have alternating signs of mass transport. This sloshing behavior spreads to the AM flux (lower panel) via the advective component of j.
Current usage metrics show cumulative count of Article Views (full-text article views including HTML views, PDF and ePub downloads, according to the available data) and Abstracts Views on Vision4Press platform.
Data correspond to usage on the plateform after 2015. The current usage metrics is available 48-96 hours after online publication and is updated daily on week days.
Initial download of the metrics may take a while.