Fig. 4
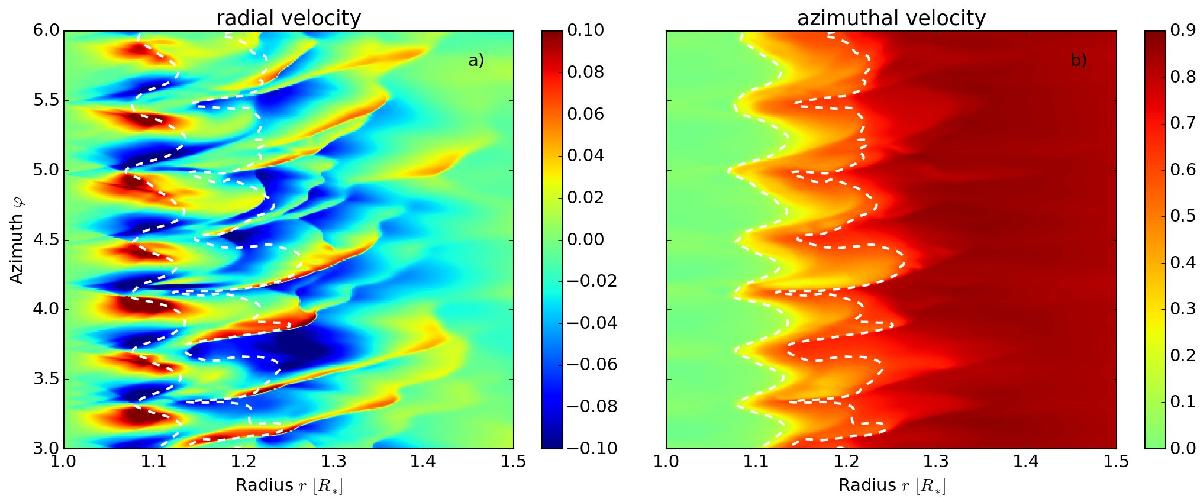
r-ϕ plot of the radial velocity a) and the azimuthal velocity b) at t = 173 orbits. Both quantities are given in units of uK(R∗). The dashed white lines in both plots trace the contour of uϕ = 0.15 and 0.6 (from left to right). The direction of the unperturbed flow is from bottom to top. The images have been taken at a high activity state and the strong shocks in ur and the heavy deformation of the interface (see b)) are clearly visible.
Current usage metrics show cumulative count of Article Views (full-text article views including HTML views, PDF and ePub downloads, according to the available data) and Abstracts Views on Vision4Press platform.
Data correspond to usage on the plateform after 2015. The current usage metrics is available 48-96 hours after online publication and is updated daily on week days.
Initial download of the metrics may take a while.