Fig. 2
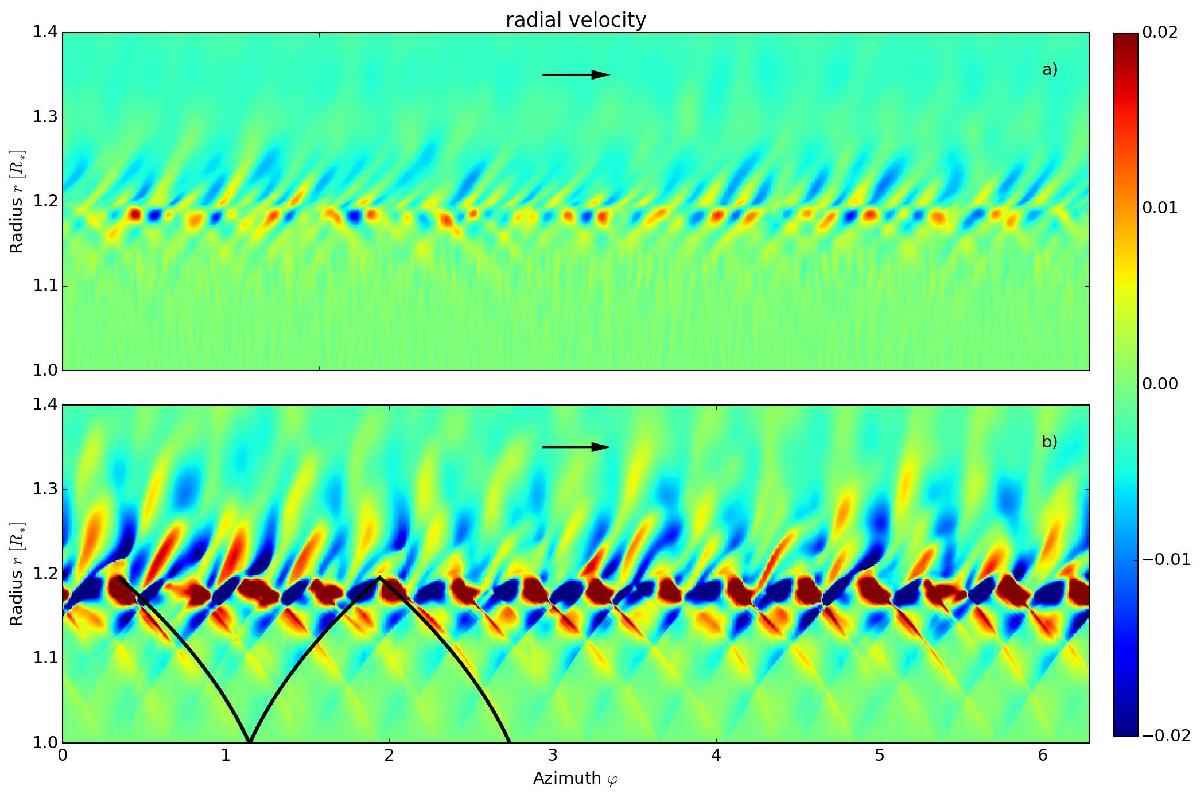
r-ϕ plot of the radial velocity in units of uK(R∗) at t = 5a) and t = 10b) orbits. The velocity in the upper panel, a), has been multiplied by a factor of 2 in order to use the same colormap as below. Both snapshots show the linear stage of the sonic instability and the middle branch in action. The sound waves are propagating toward the inner and the outer edge of the domain in an oblique fashion. The three black lines in panel b) illustrate the wavefronts. The arrows denote the direction of the unperturbed azimuthal flow.
Current usage metrics show cumulative count of Article Views (full-text article views including HTML views, PDF and ePub downloads, according to the available data) and Abstracts Views on Vision4Press platform.
Data correspond to usage on the plateform after 2015. The current usage metrics is available 48-96 hours after online publication and is updated daily on week days.
Initial download of the metrics may take a while.