Fig. 15
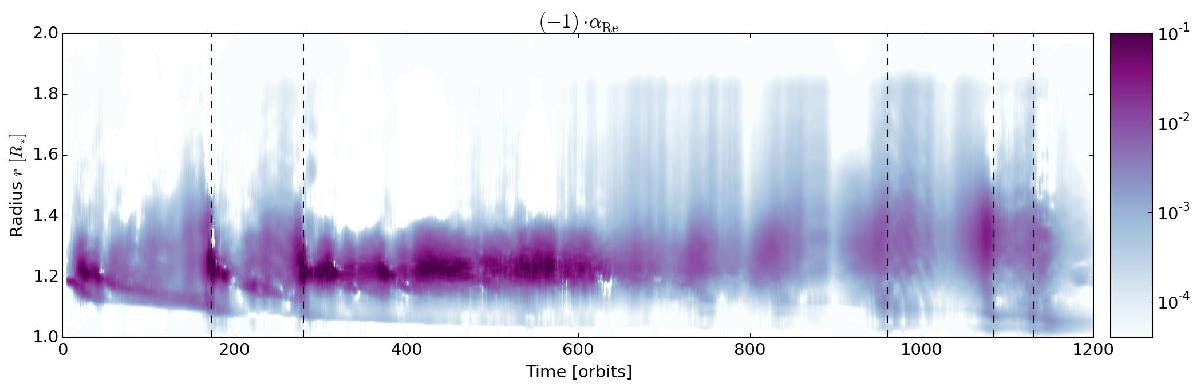
Time-radius image of αRe spanning several hundred orbits. We note that the values of αRe have been multiplied by (− 1) in order to allow for the logarithmic scale. For each point in time the values have been time average over ten orbits. The vertical dashed lines denote the locations of the outbursts mentioned earlier in the text.
Current usage metrics show cumulative count of Article Views (full-text article views including HTML views, PDF and ePub downloads, according to the available data) and Abstracts Views on Vision4Press platform.
Data correspond to usage on the plateform after 2015. The current usage metrics is available 48-96 hours after online publication and is updated daily on week days.
Initial download of the metrics may take a while.