Fig. 13
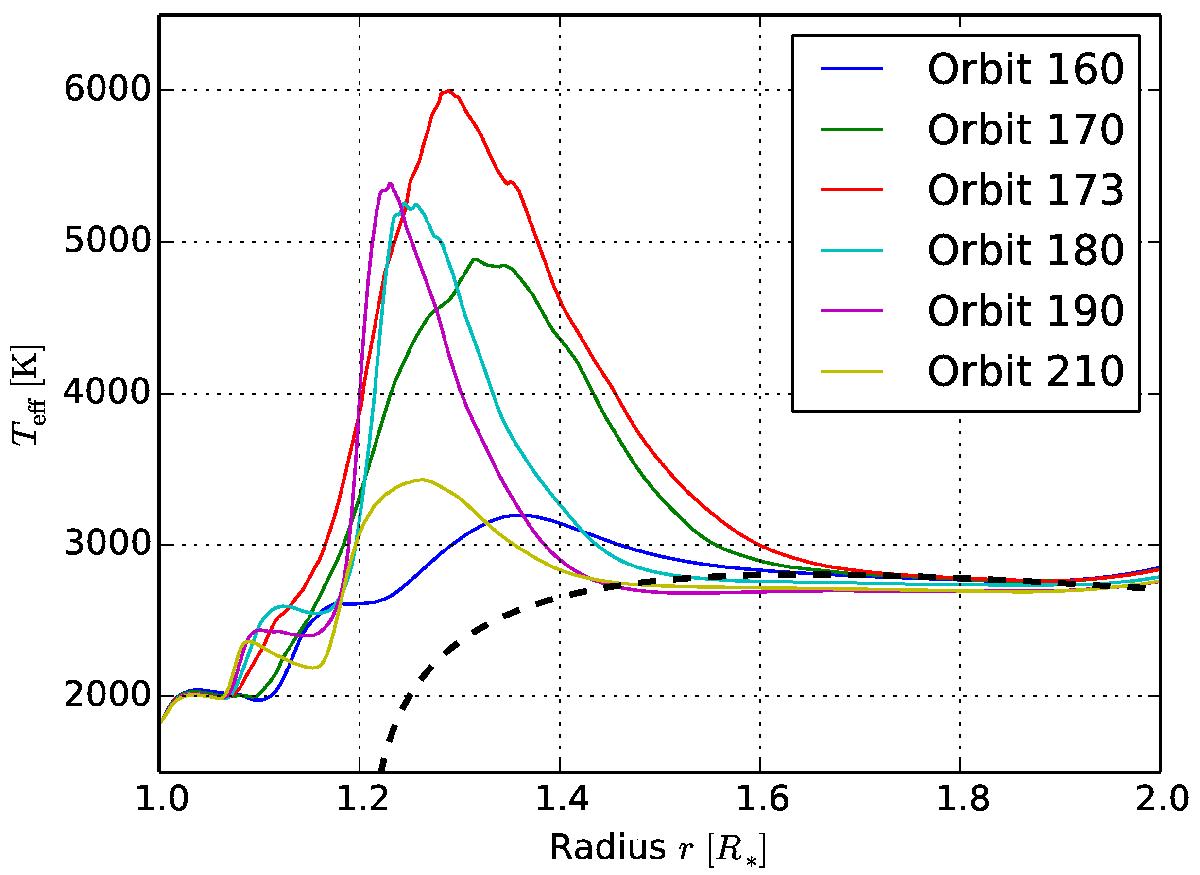
Azimuthally averaged effective temperature of the BL for six time steps centered around the second outburst (see Fig. 6). Teff increases considerably during the outburst and then declines to approximately the pre-outburst level ∼30 orbits after the peak of the outburst. The black dashed line corresponds to the surface temperature of the standard solution of Shakura & Sunyaev (1973).
Current usage metrics show cumulative count of Article Views (full-text article views including HTML views, PDF and ePub downloads, according to the available data) and Abstracts Views on Vision4Press platform.
Data correspond to usage on the plateform after 2015. The current usage metrics is available 48-96 hours after online publication and is updated daily on week days.
Initial download of the metrics may take a while.