Fig. 10
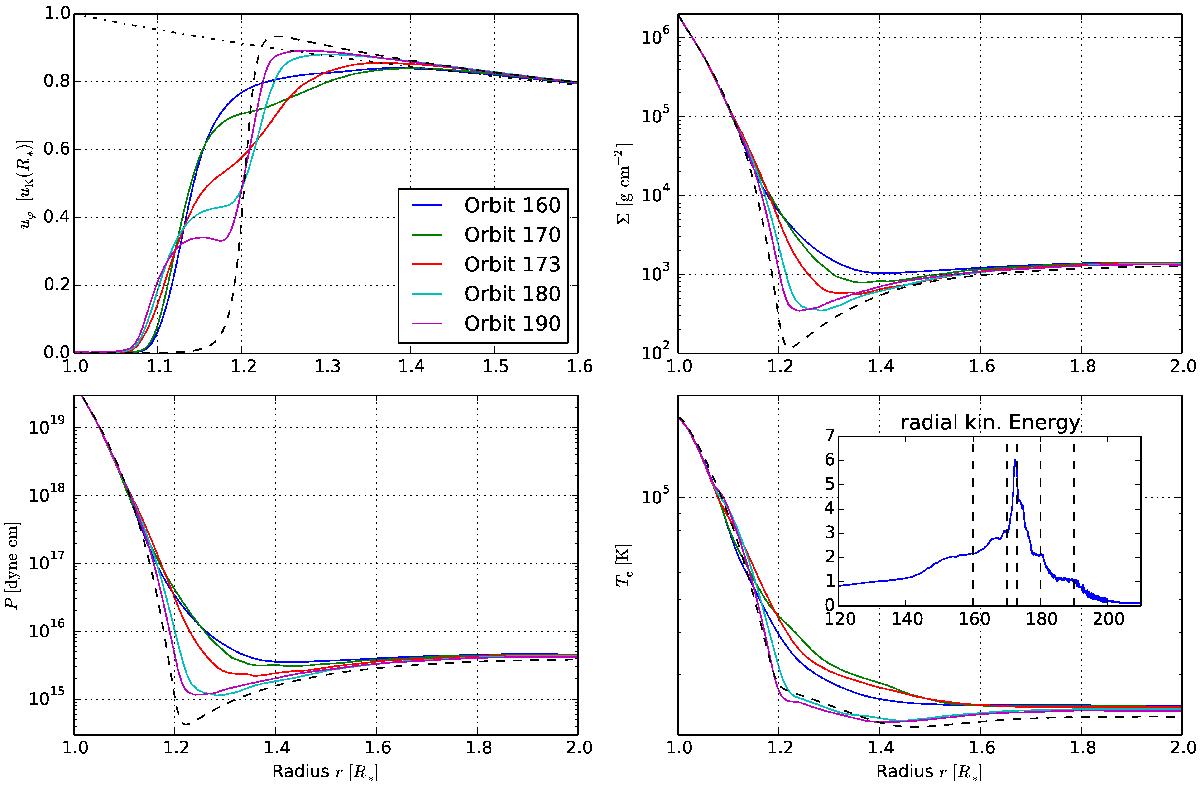
Azimuthal velocity, the surface density, the pressure, and the midplane temperature for five time steps centered around the second outburst. The dashed lines denote the initial conditions of the simulations. The dash-dotted line in the upper left panel gives the azimuthal velocity for pure Keplerian rotation. In the lower right panel we have included a zoom-in of Fig. 6 for better identification of the exact location of the plot times.
Current usage metrics show cumulative count of Article Views (full-text article views including HTML views, PDF and ePub downloads, according to the available data) and Abstracts Views on Vision4Press platform.
Data correspond to usage on the plateform after 2015. The current usage metrics is available 48-96 hours after online publication and is updated daily on week days.
Initial download of the metrics may take a while.