Fig. 6
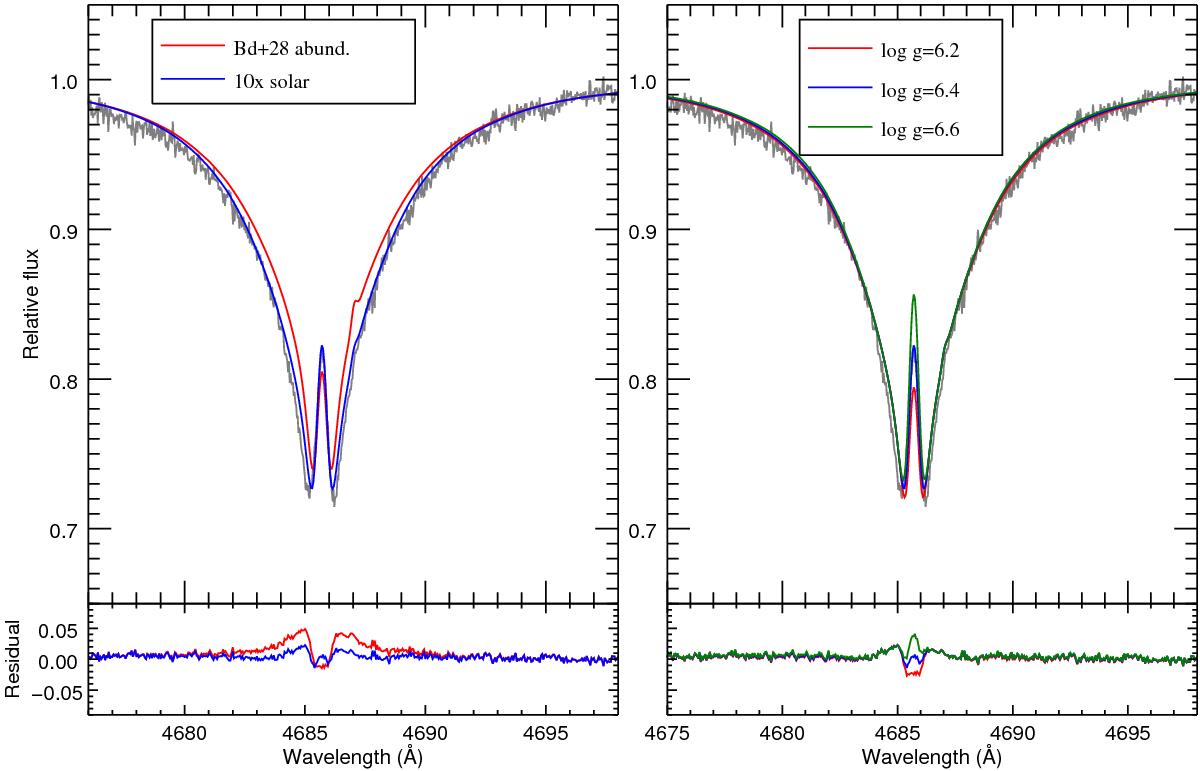
Comparison between synthetic spectra and the He ii 4686 Å line from HIRES (1997-08-12). Left panel: synthetic spectra from models at 82 000 K, log g = 6.4, and log N(He)/N(H) = −1.0. The red spectrum comes from a model with the abundances of BD+28°4211 determined in Paper I. The blue spectrum is from a model with ten times solar metallicity. Right panel: spectra from the ten times solar metallicity grid with various surface gravities.
Current usage metrics show cumulative count of Article Views (full-text article views including HTML views, PDF and ePub downloads, according to the available data) and Abstracts Views on Vision4Press platform.
Data correspond to usage on the plateform after 2015. The current usage metrics is available 48-96 hours after online publication and is updated daily on week days.
Initial download of the metrics may take a while.