Fig. 4
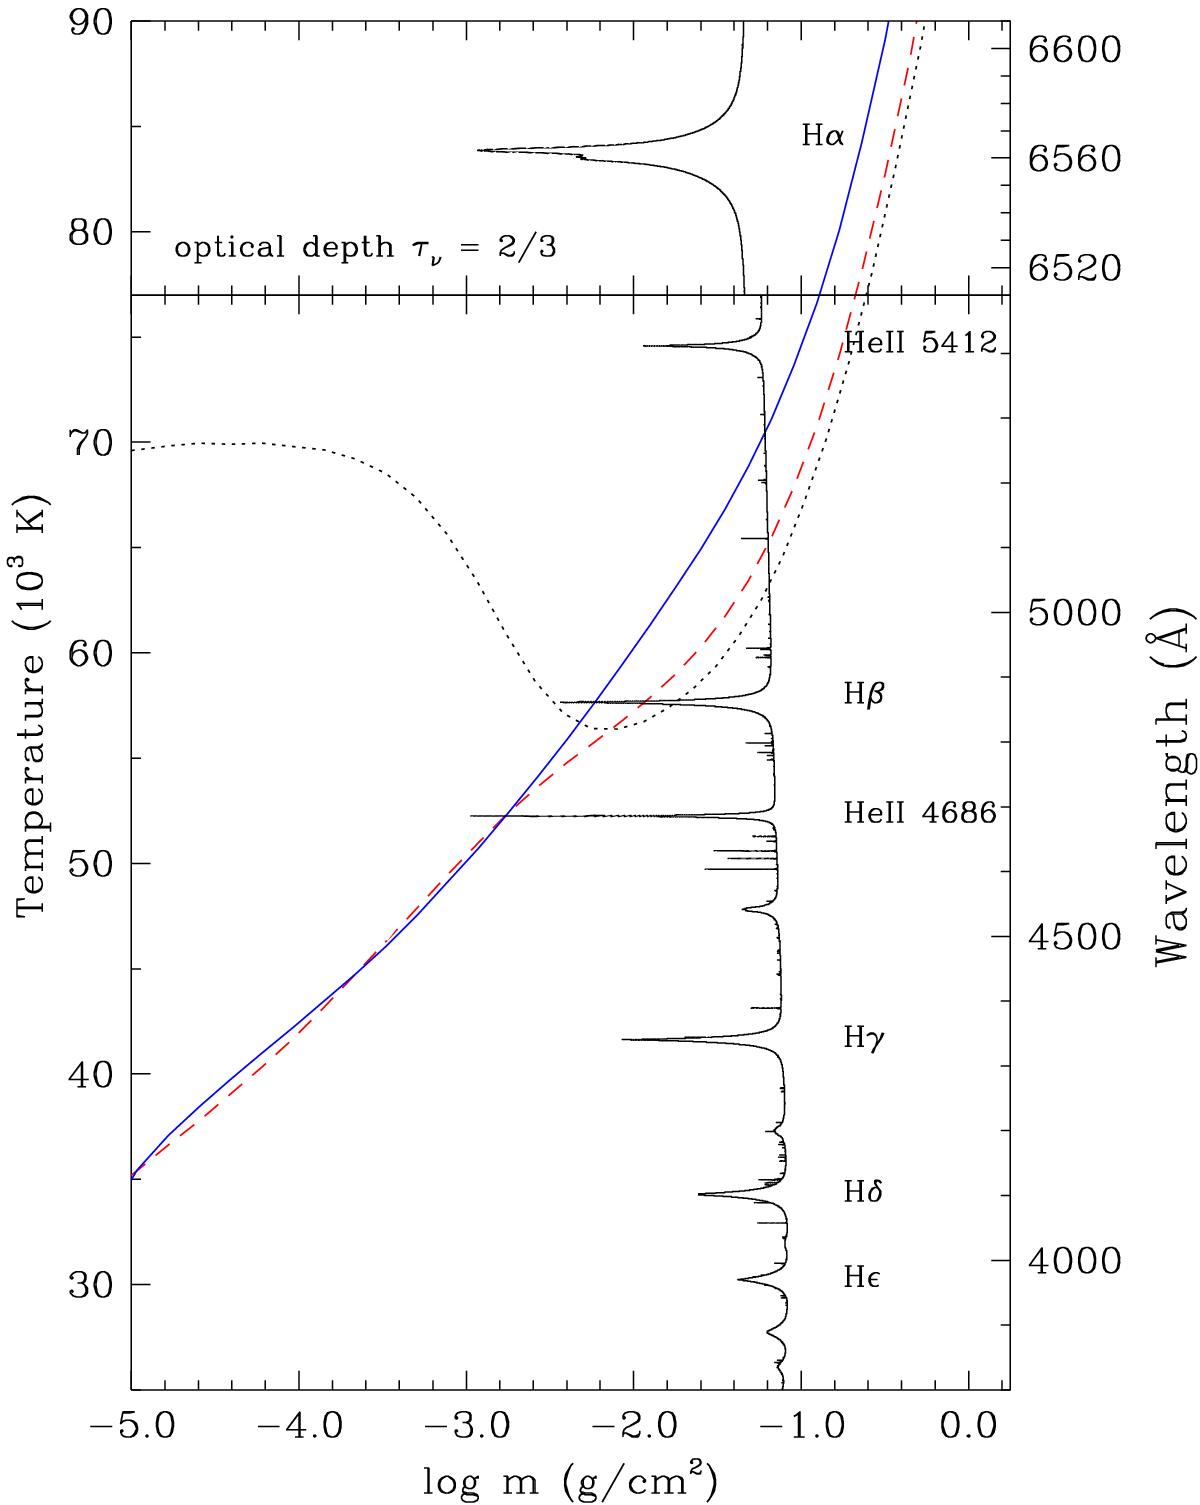
Temperature stratification and monochromatic optical depth τν = 2/3 as functions of depth, where m is the column density, for NLTE models defined by Teff = 82 000 K, log g = 6.4, and log N(He)/N(H) = −1.0. The temperature structure is shown for three model atmospheres with different compositions: with only H and He (black, dotted), with the metallic abundances of BD+28°4211 (red, dashed), and with ten times solar abundances (blue, solid). The τν = 2/3 curve is from the latter model and shows wavelength intervals corresponding to the Balmer line series.The wavelength sampling of this curve is about 0.3 Å.
Current usage metrics show cumulative count of Article Views (full-text article views including HTML views, PDF and ePub downloads, according to the available data) and Abstracts Views on Vision4Press platform.
Data correspond to usage on the plateform after 2015. The current usage metrics is available 48-96 hours after online publication and is updated daily on week days.
Initial download of the metrics may take a while.