Fig. 9
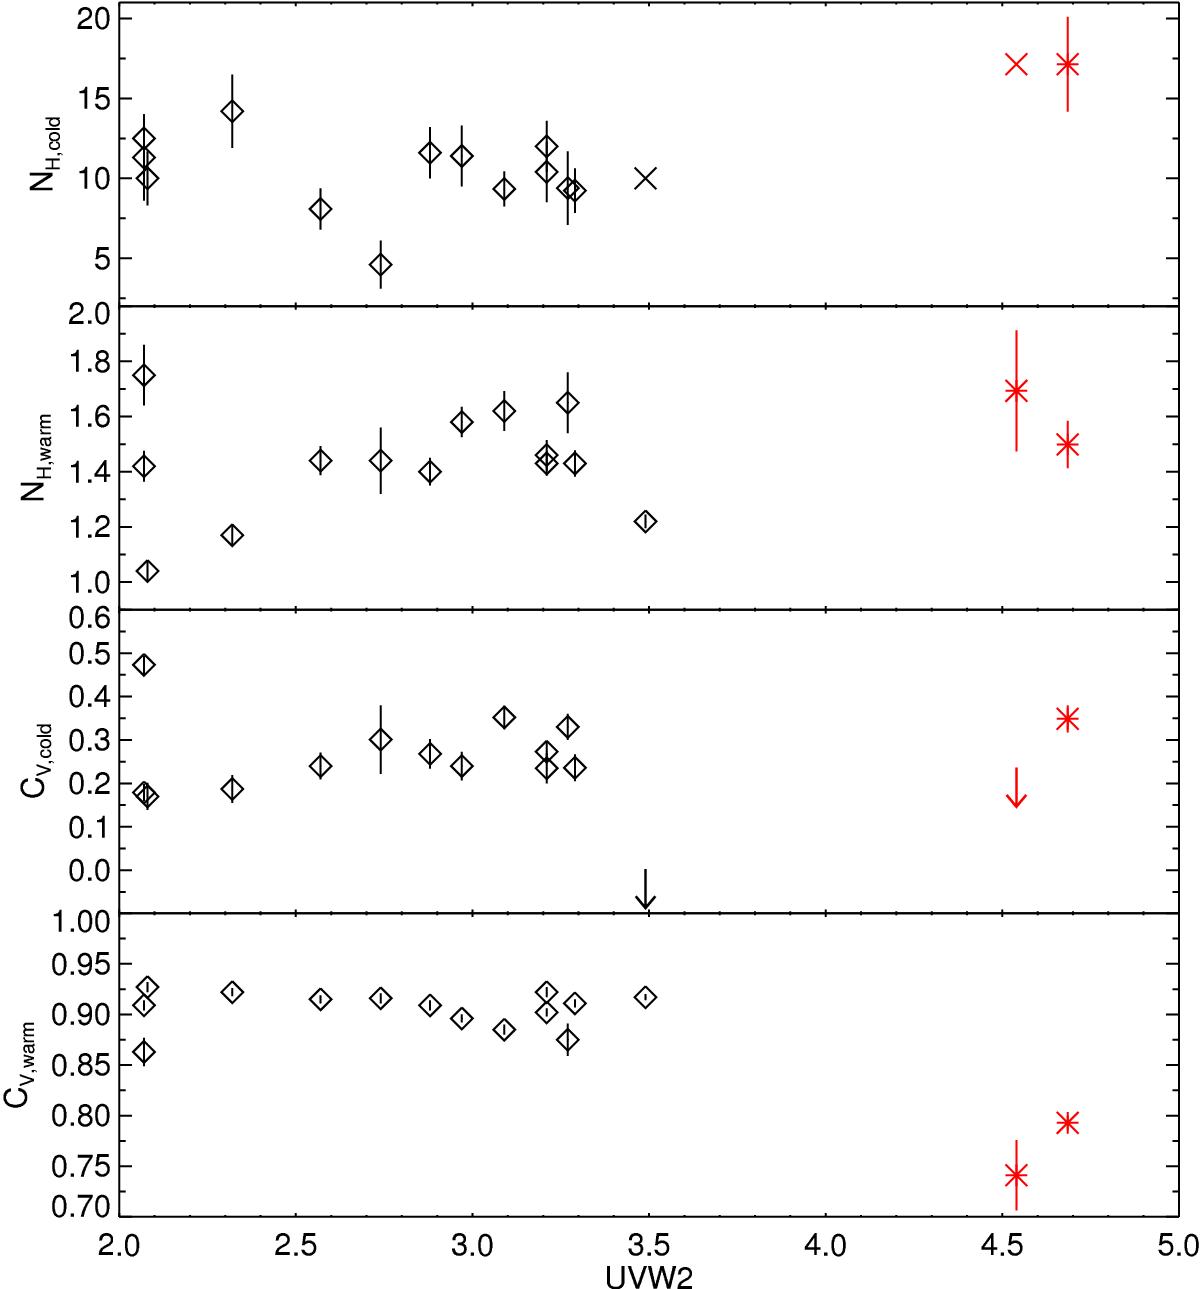
From top to bottom panel: column densities of the cold and the warm obscurer, covering fraction of the cold and the warm obscurer plotted as function of the flux in the UVW2 filter. Column densities are plotted in units of 1022 cm-2. The UVW2 flux is plotted in units of 10-14 erg s-1 cm-2 A-1. Black diamonds and red asterisks identify parameters measured with XMM-Newton and Chandra-LETGS, respectively. Error bars, when larger than the size of the plotting symbol, are also shown. Upper limits are plotted as an arrow. Crosses represent values that were kept frozen in the fits.
Current usage metrics show cumulative count of Article Views (full-text article views including HTML views, PDF and ePub downloads, according to the available data) and Abstracts Views on Vision4Press platform.
Data correspond to usage on the plateform after 2015. The current usage metrics is available 48-96 hours after online publication and is updated daily on week days.
Initial download of the metrics may take a while.