Fig. 8
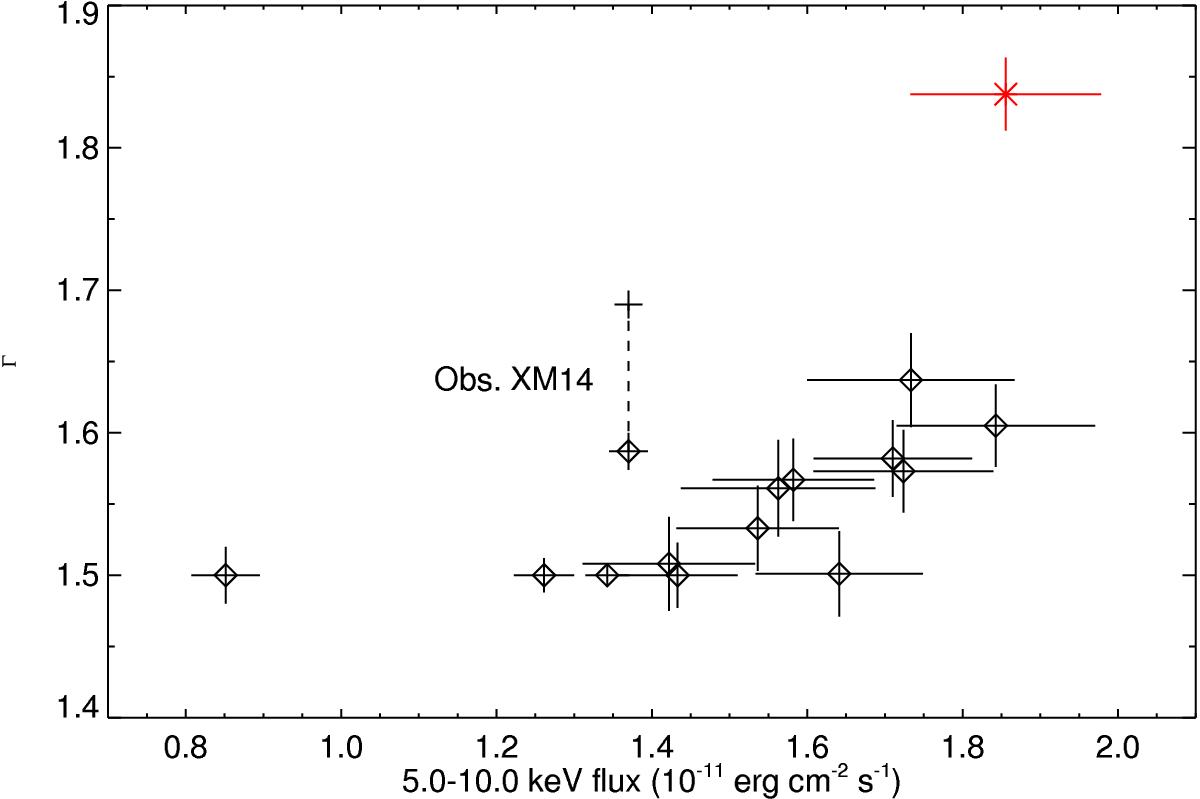
Fitted continuum slope as a function of the observed 5.0−10.0 keV flux for all XMM-Newton and Chandra data sets, with errors. Black diamonds and red asterisk identify parameters measured with XMM-Newton and Chandra-LETGS, respectively. The black cross represents the higher value of Γ that, for Obs. XM14, would be required by a fit including the cold obscurer (see Sect. 4.3).
Current usage metrics show cumulative count of Article Views (full-text article views including HTML views, PDF and ePub downloads, according to the available data) and Abstracts Views on Vision4Press platform.
Data correspond to usage on the plateform after 2015. The current usage metrics is available 48-96 hours after online publication and is updated daily on week days.
Initial download of the metrics may take a while.