Fig. 5
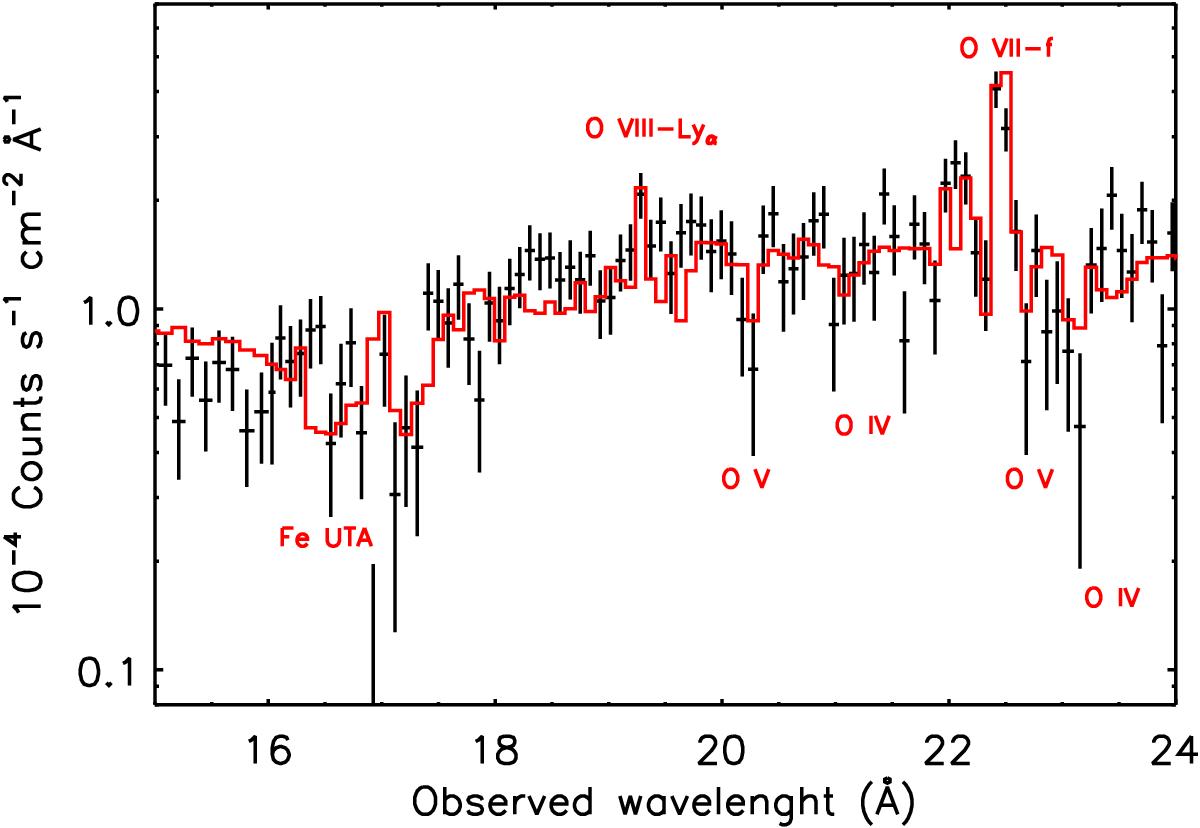
Chandra-LETGS spectrum of NGC 5548 in the 15−24 Å wavelength region. The solid line represents our best-fit model. The most prominent emission and absorption features are labeled. The spectrum shows some WA signatures (Fe-UTA, O iv−O v) that were not detected during the XMM-Newton campaign.
Current usage metrics show cumulative count of Article Views (full-text article views including HTML views, PDF and ePub downloads, according to the available data) and Abstracts Views on Vision4Press platform.
Data correspond to usage on the plateform after 2015. The current usage metrics is available 48-96 hours after online publication and is updated daily on week days.
Initial download of the metrics may take a while.