Fig. 2
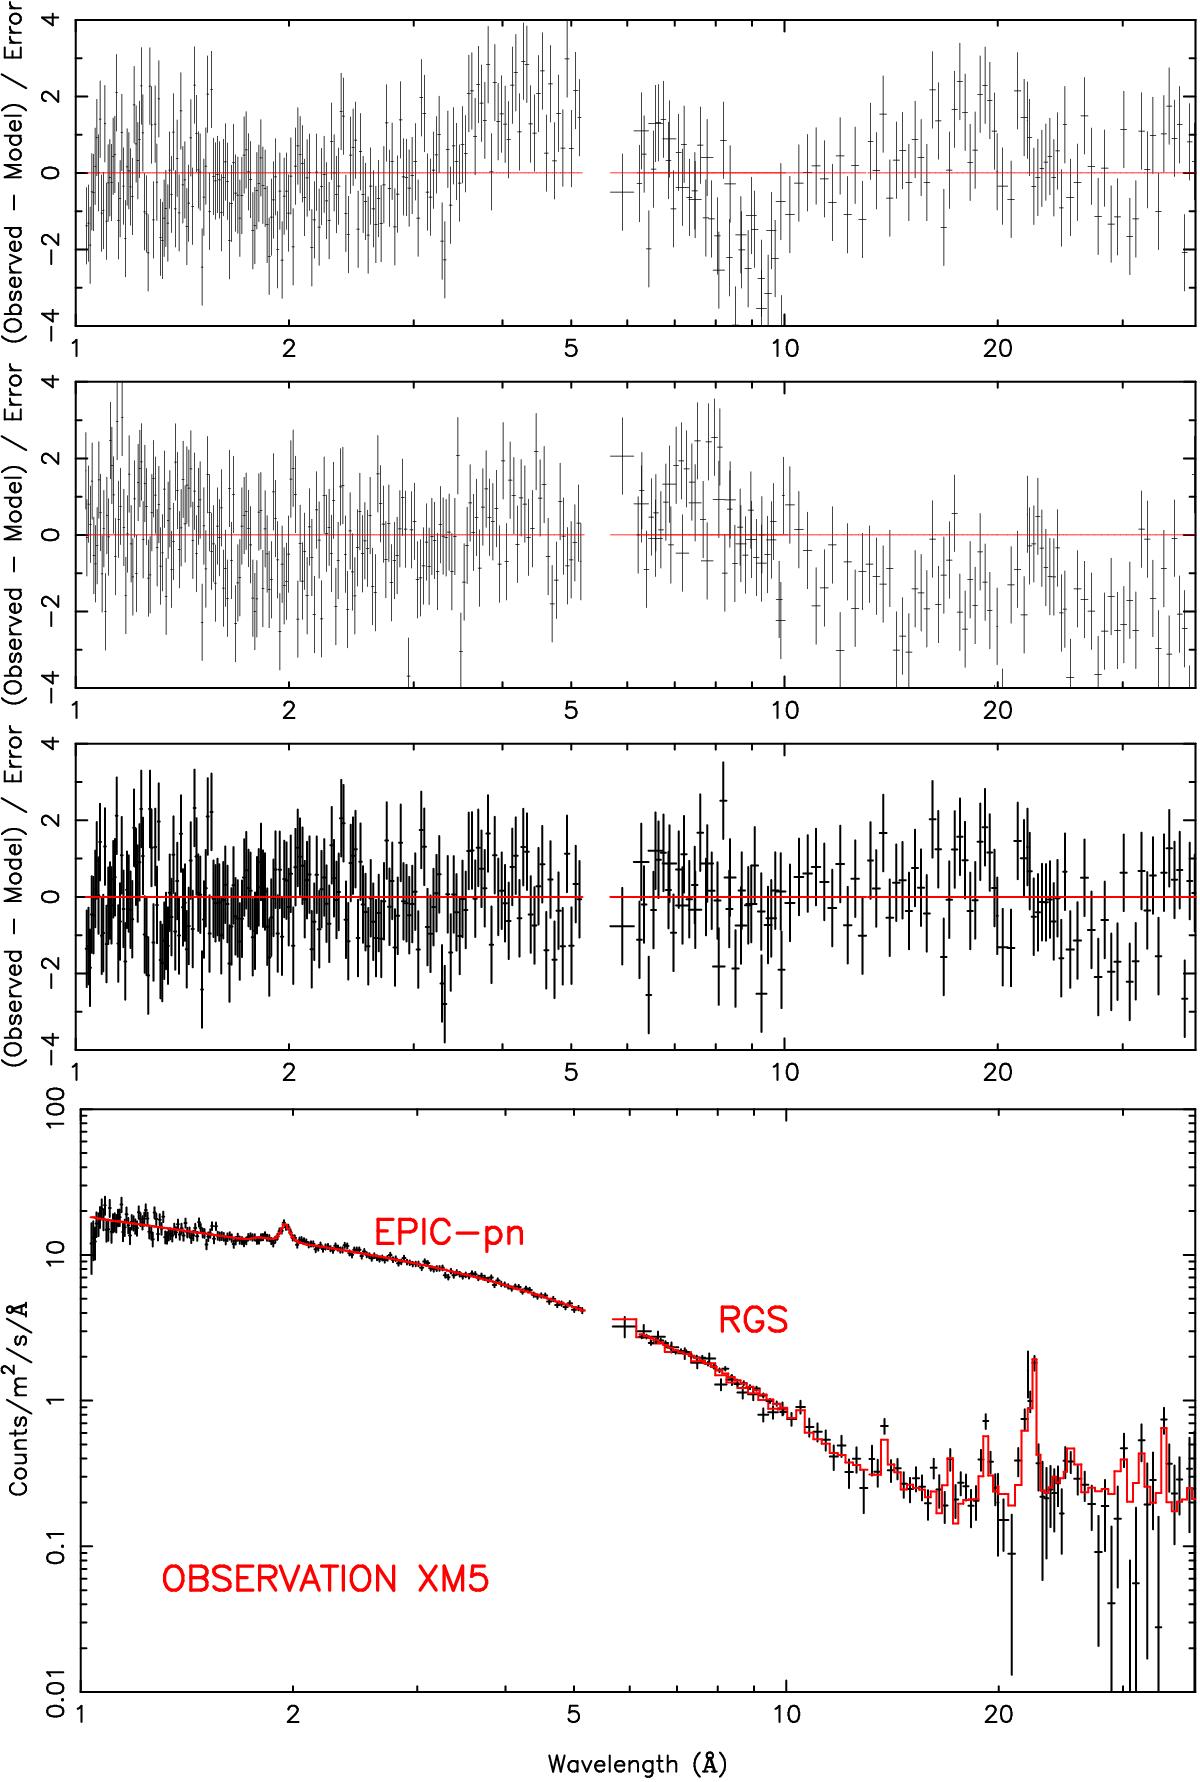
Examples of fits the XMM-Newton spectrum of Obs. XM5. From top to bottom panel: fit residuals when only the obscurers covering fractions are allowed to vary from the values obtained for the average spectrum; fit residuals when only the obscurers column densities are allowed to vary from the values obtained for the average spectrum; fit residuals of the best-fit model where both column densities and covering fractions are permitted to vary freely; spectrum of observation XM5. The solid line represents the best-fit model. We rebinned the data for clarity.
Current usage metrics show cumulative count of Article Views (full-text article views including HTML views, PDF and ePub downloads, according to the available data) and Abstracts Views on Vision4Press platform.
Data correspond to usage on the plateform after 2015. The current usage metrics is available 48-96 hours after online publication and is updated daily on week days.
Initial download of the metrics may take a while.