Fig. 1
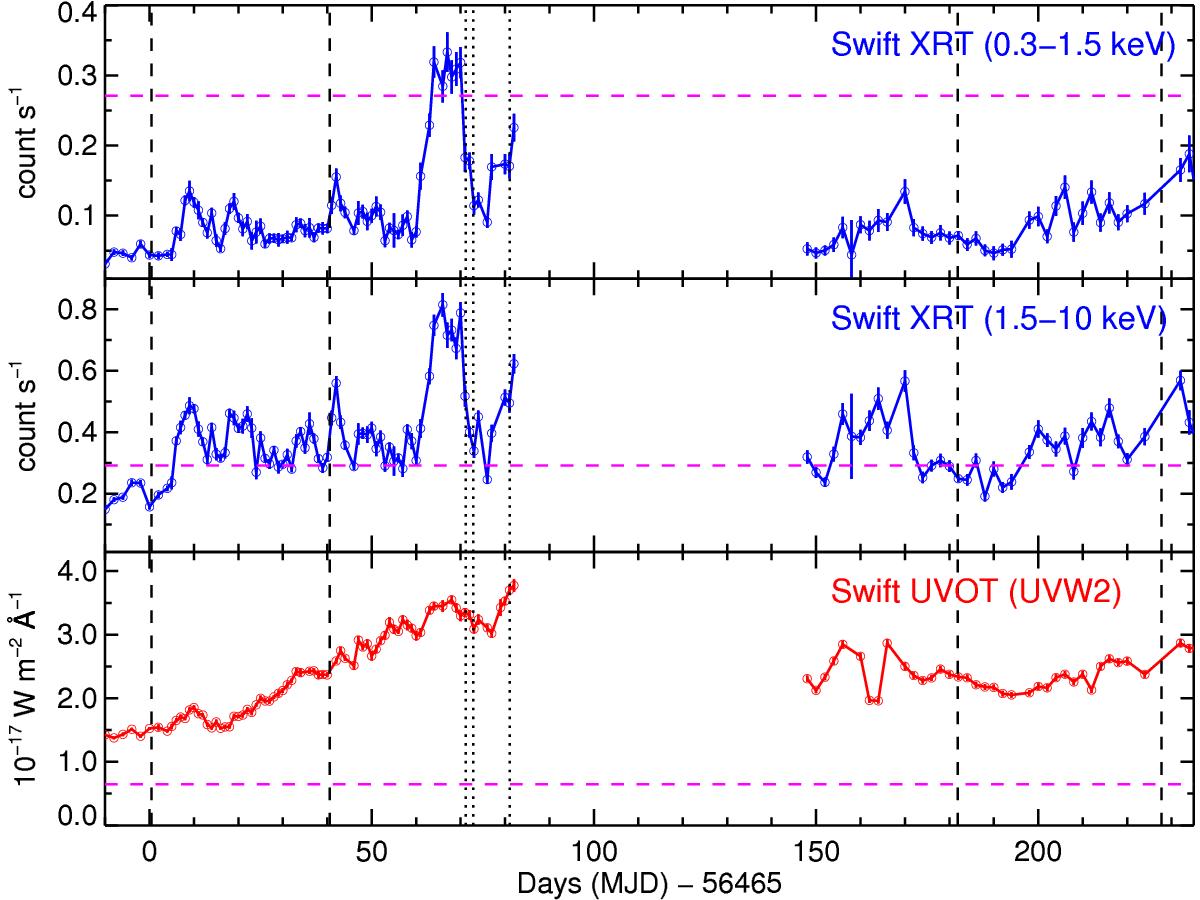
From top to bottom panel: observed light curves of NGC 5548 in two X-ray bands and in the UV (λ = 2030 Å). These curves are obtained from the daily Swift monitoring performed during our campaign. In each panel, the pink horizontal dashed line marks the flux level measured by Swift at unobscured epochs (2005 and 2007). From left to right, vertical lines indicate first and last XMM-Newton observation of summer 2013 (dashed lines), the three Chandra observations of September 2013 (dotted lines), and the last two observations of the XMM-Newton program (in December 2013 and February 2014, dashed lines).
Current usage metrics show cumulative count of Article Views (full-text article views including HTML views, PDF and ePub downloads, according to the available data) and Abstracts Views on Vision4Press platform.
Data correspond to usage on the plateform after 2015. The current usage metrics is available 48-96 hours after online publication and is updated daily on week days.
Initial download of the metrics may take a while.