Fig. 3
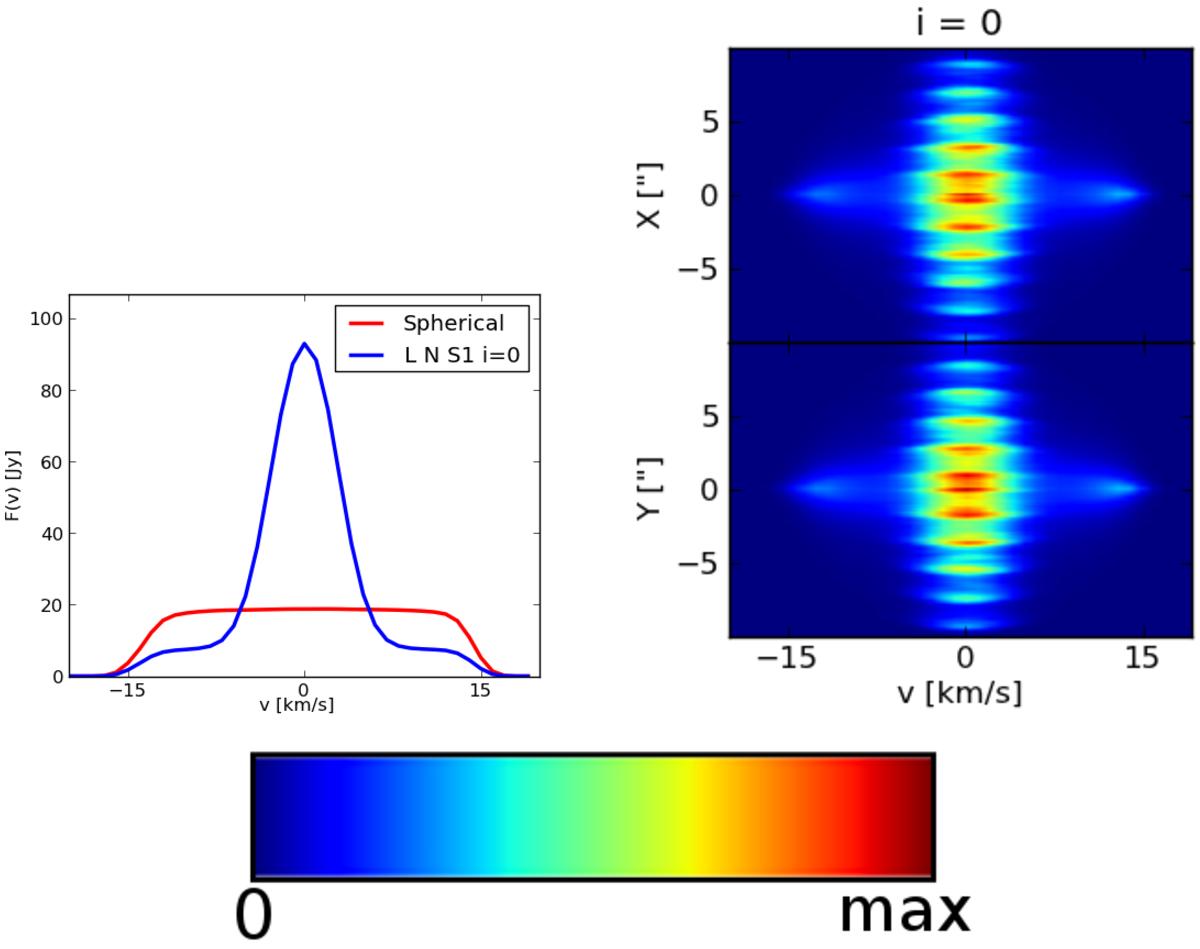
Top left: spectral line of the reference model (blue), seen from an inclination angle of 0 degree (face-on). Overplotted is the spectral line of an exclusively homogeneous spherical outflow with identical global characteristics. Top right: wide-slit PV diagram of the reference model. The linear colour map at the bottom provides a reference to the colour coding. Every coloured diagram is constructed using this map. MAX represents the maximum emission in the PV diagram.
Current usage metrics show cumulative count of Article Views (full-text article views including HTML views, PDF and ePub downloads, according to the available data) and Abstracts Views on Vision4Press platform.
Data correspond to usage on the plateform after 2015. The current usage metrics is available 48-96 hours after online publication and is updated daily on week days.
Initial download of the metrics may take a while.