Fig. 16
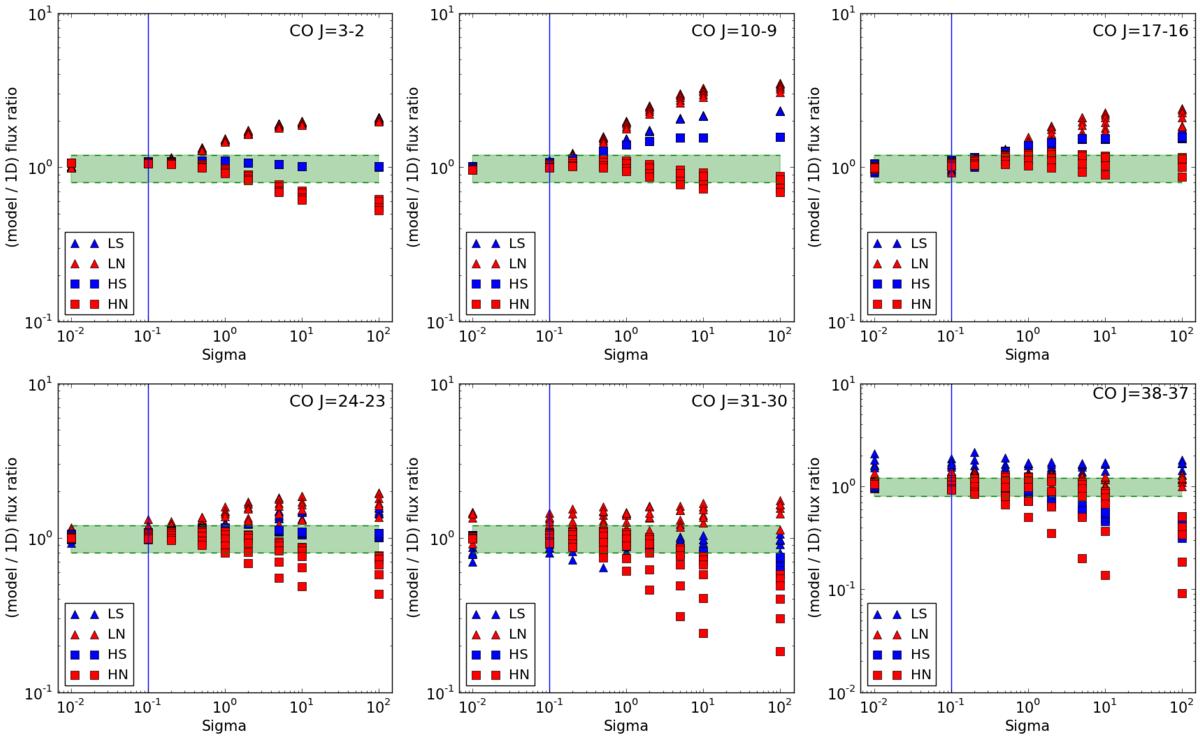
Ratio between the integrated flux of the spiral models, and the integrated flux of its 1D equivalent, in which all material is located in a homogeneous outflow. In principle this figure should exhibit identical amounts of red and blue markers, but a major overlap of both has resulted in an artificial bias favouring the red-labelled models. The green zone represents the instrumental calibration errors. The blue vertical line respresents the Σ value found in the hydrodynamical simulations of Kim & Taam (2012).
Current usage metrics show cumulative count of Article Views (full-text article views including HTML views, PDF and ePub downloads, according to the available data) and Abstracts Views on Vision4Press platform.
Data correspond to usage on the plateform after 2015. The current usage metrics is available 48-96 hours after online publication and is updated daily on week days.
Initial download of the metrics may take a while.