Fig. 15
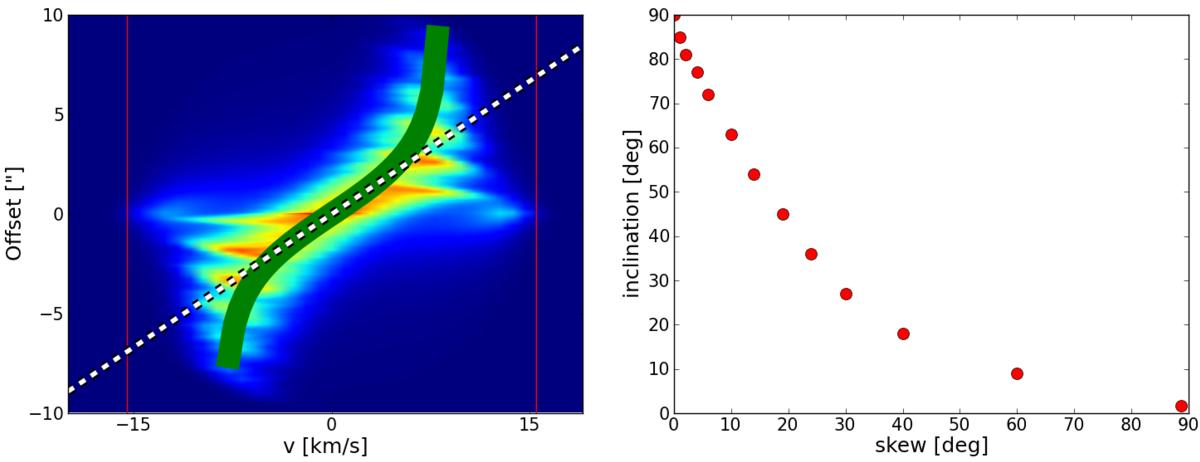
Left panel: a visual representation of the analytical model (green curve, Eq. (12)) used to fit the emission features of the PV diagrams, applied to the reference model at an inclination of 36◦. The slope of the curve around v = 0 km s-1 (white dashed line) determines the characteristical skew of the diagram. Right panel: relation between the measured skew of the PV diagram and the inclination angle.
Current usage metrics show cumulative count of Article Views (full-text article views including HTML views, PDF and ePub downloads, according to the available data) and Abstracts Views on Vision4Press platform.
Data correspond to usage on the plateform after 2015. The current usage metrics is available 48-96 hours after online publication and is updated daily on week days.
Initial download of the metrics may take a while.