Fig. 6
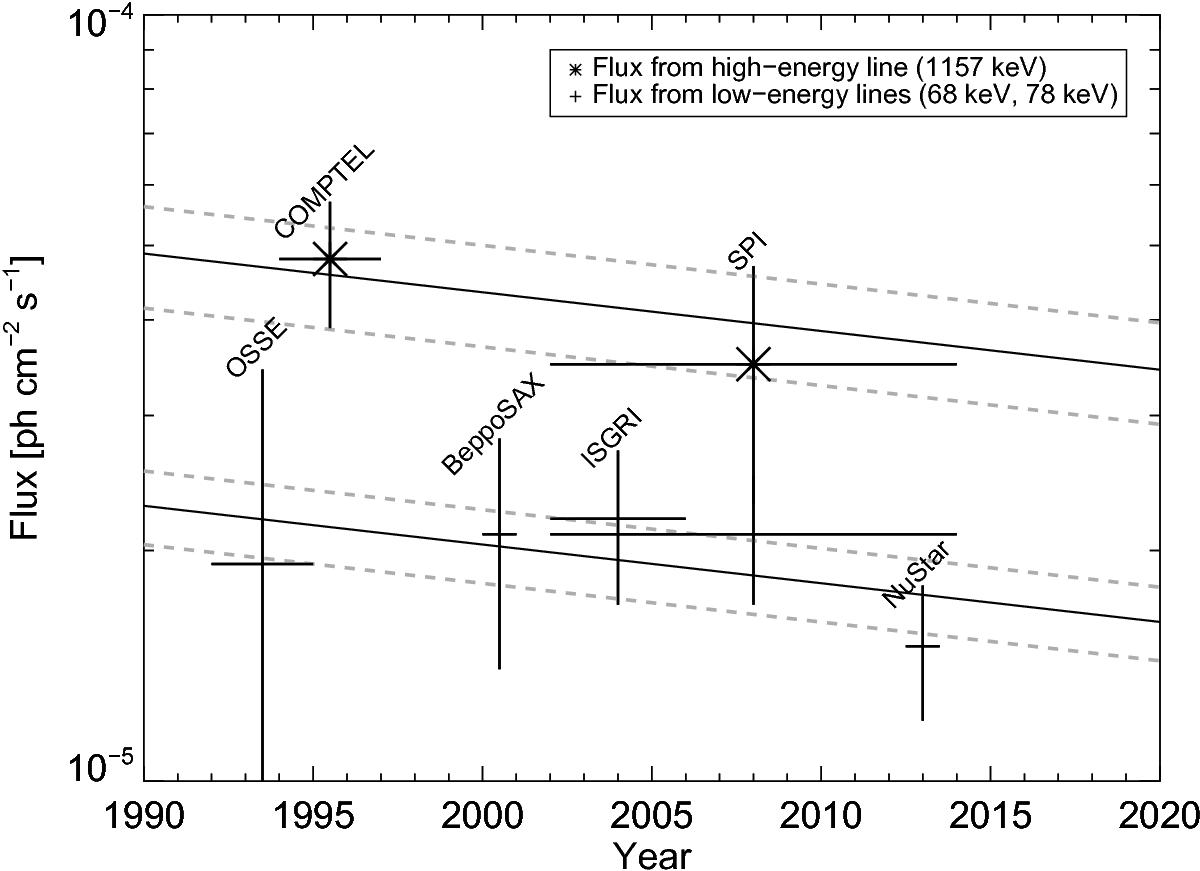
Compilation of γ-ray flux measurements in Cas A from different instruments during the years 1992 to 2014 (see text). To each family of lines (low- and high-energy), an exponential decay function has been fitted, fixing the half-life time of 44Ti to 86 a and the explosion date to AD 1671 (solid lines). The 1σ uncertainties are separately shown by dashed gray lines for each fit. The discrepancy can be expressed as a constant flux level of (2.29 ± 0.62) × 10-5 ph cm-2 s-1.
Current usage metrics show cumulative count of Article Views (full-text article views including HTML views, PDF and ePub downloads, according to the available data) and Abstracts Views on Vision4Press platform.
Data correspond to usage on the plateform after 2015. The current usage metrics is available 48-96 hours after online publication and is updated daily on week days.
Initial download of the metrics may take a while.