Fig. 5
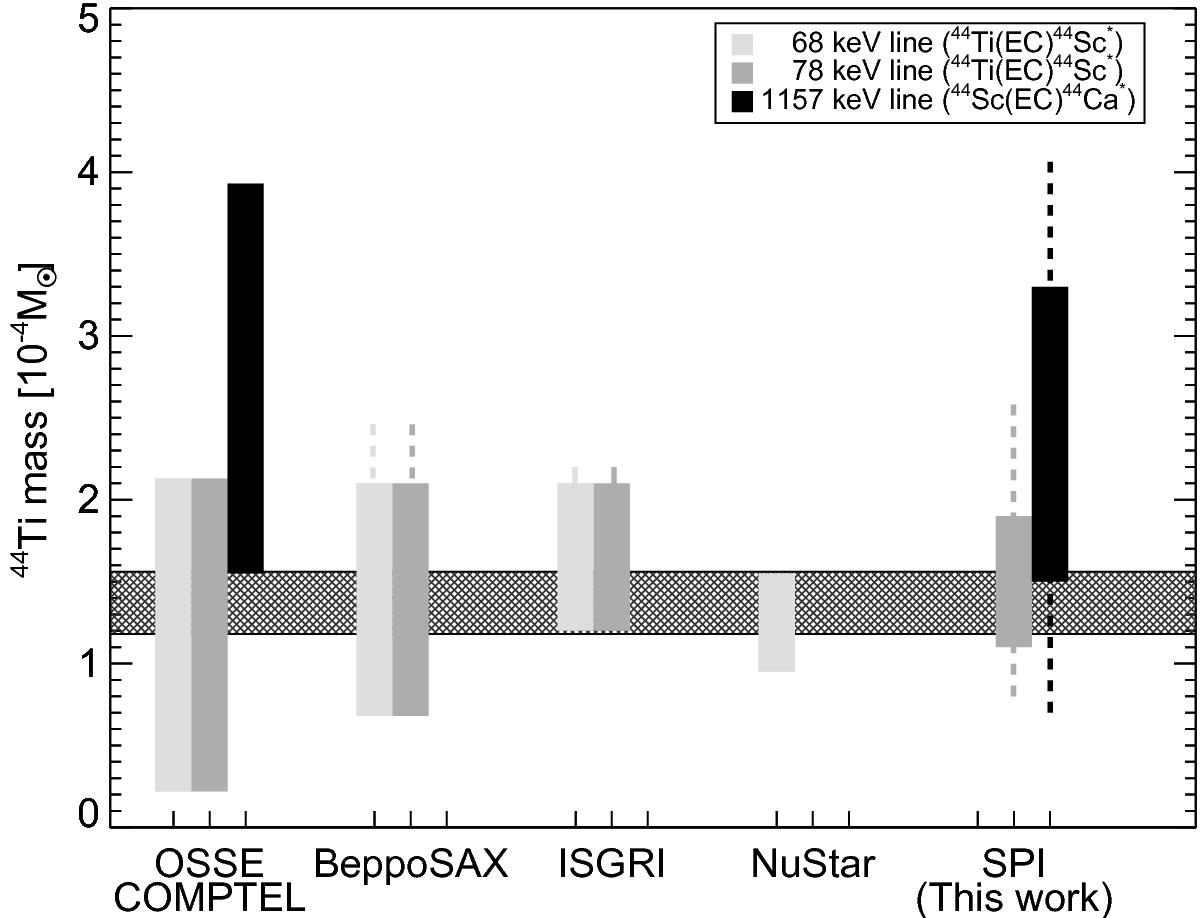
Derived 44Ti masses of different instruments. All data bars are drawn from the measurements with only the given instrument (no combinations), including the uncertainties in half-life time and explosion date. The OSSE and COMPTEL values are corrected for the distance to Cas A. Upper limits (if given) are shown as dashed lines. The yields measured by COMPTEL and SPI using the 1157 keV line are systematically higher than values using the low-energy lines. The calculated weighted mean of all shown measurements is illustrated as the hatched area and is (1.37 ± 0.19) × 10-4 M⊙.
Current usage metrics show cumulative count of Article Views (full-text article views including HTML views, PDF and ePub downloads, according to the available data) and Abstracts Views on Vision4Press platform.
Data correspond to usage on the plateform after 2015. The current usage metrics is available 48-96 hours after online publication and is updated daily on week days.
Initial download of the metrics may take a while.