Fig. 4
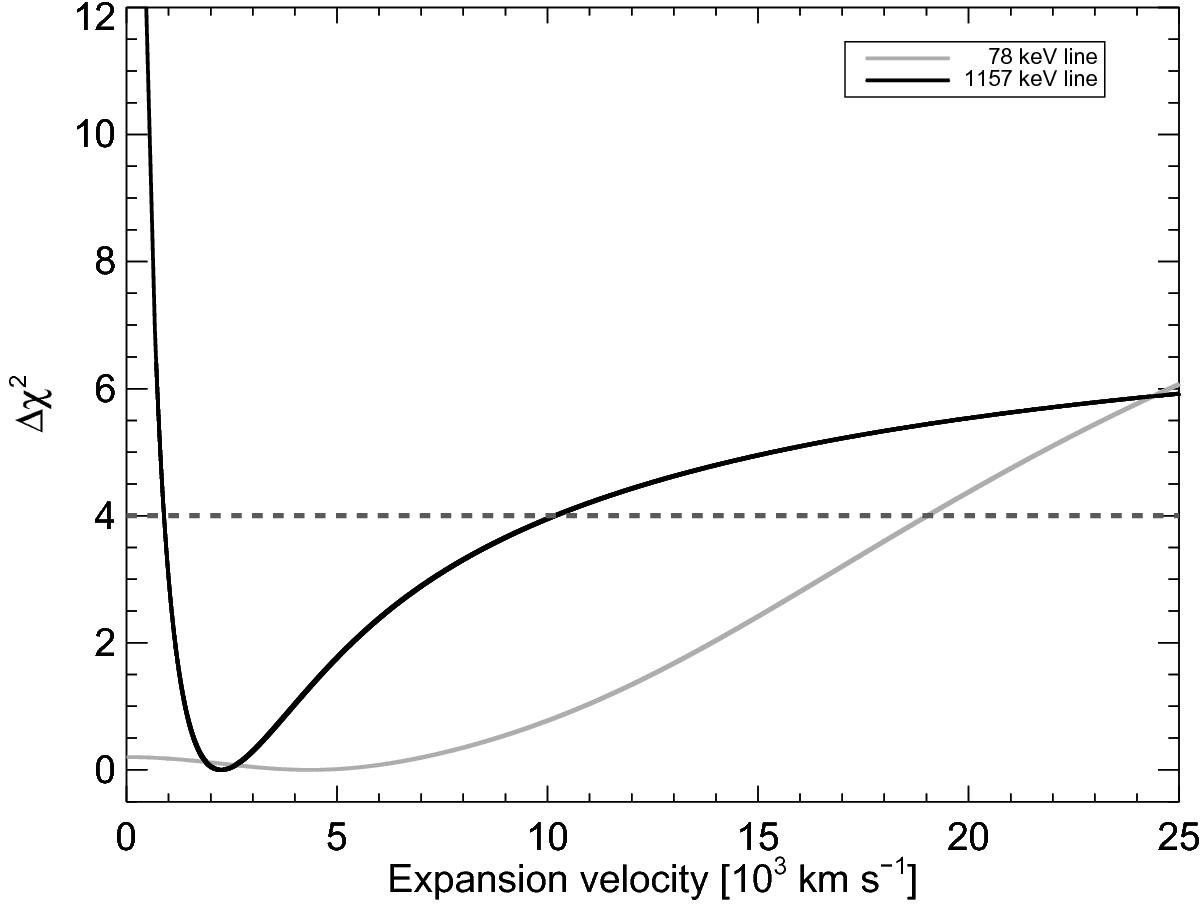
Δχ2 vs. expansion velocity for the two detected lines, individually. The values are calculated assuming the best-fit values in each case, only letting the Gaussian width vary. Because of the higher resolving power of SPI at 1 MeV with respect to lower energies, the value for the expansion velocity derived form the high-energy line (solid black) is more constrained than that from the low-energy line (solid gray). For comparison, the 2σ limits are indicated by the thick dashed line.
Current usage metrics show cumulative count of Article Views (full-text article views including HTML views, PDF and ePub downloads, according to the available data) and Abstracts Views on Vision4Press platform.
Data correspond to usage on the plateform after 2015. The current usage metrics is available 48-96 hours after online publication and is updated daily on week days.
Initial download of the metrics may take a while.