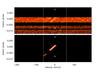
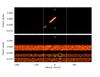
Fig. 8

Upper panel: residual map of dataset 2013 after subtraction of Run 2012 best model stellar profile, plotted on the same scales as in Fig. 6 for a better comparison. CCFs are plotted as a function of radial velocity relative to the star, with vertical dashed white lines at ± v sin i⋆. Orbital phase increases vertically, with white diamonds plotted at ingress and egress. The signature of KOI-12.01 is mainly visible as a moderately bright streak near the center of the transit, and is consistent in terms of phase and velocity with the best-fit model signature from Run 2012, displayed in the middle panel at the phases of Run 2013 spectra. Lower panel: residual map after the further subtraction of Run 2012 model planet signature. Data is noisier at the beginning of the run, with two CCFs in particular (phases –0.0071 and –0.0062) showing sharp anomalous dips near 25 km s-1 (highlighted with a green ellipse).
Current usage metrics show cumulative count of Article Views (full-text article views including HTML views, PDF and ePub downloads, according to the available data) and Abstracts Views on Vision4Press platform.
Data correspond to usage on the plateform after 2015. The current usage metrics is available 48-96 hours after online publication and is updated daily on week days.
Initial download of the metrics may take a while.