Fig. 5
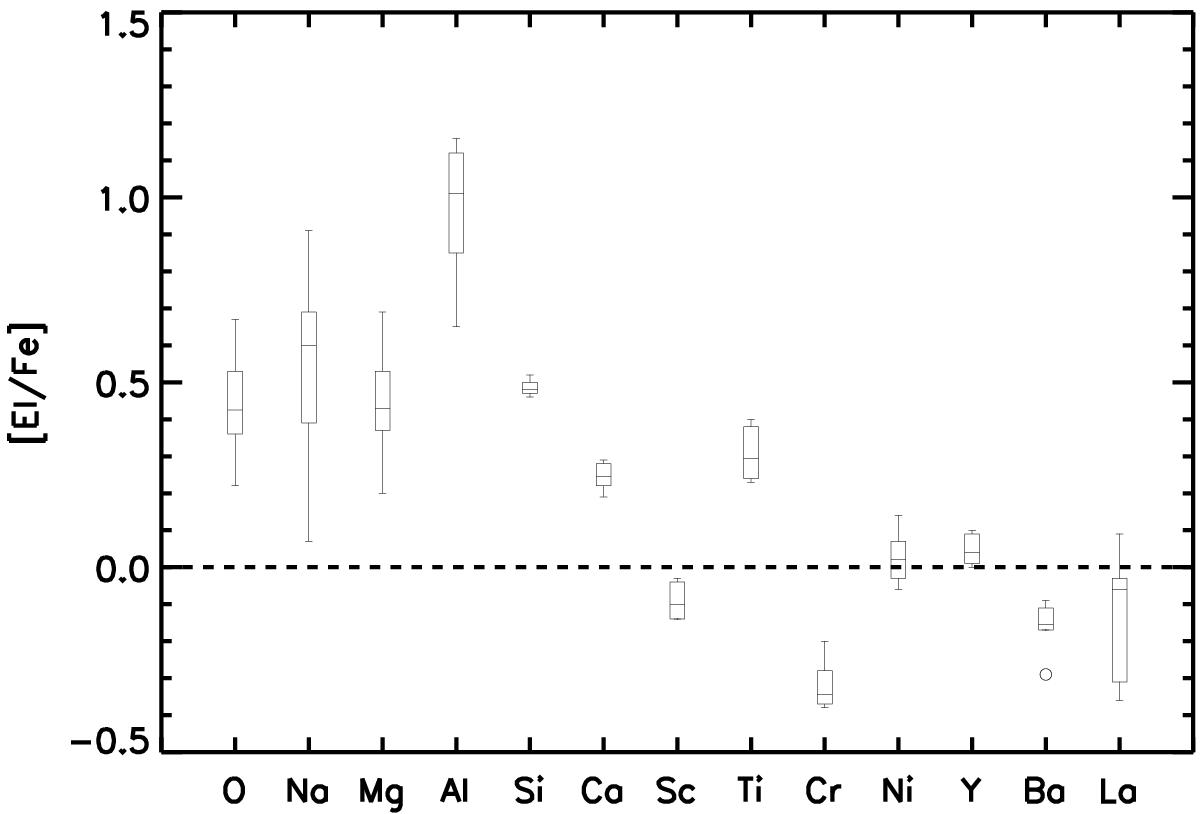
Box plot of the NGC 4372 star element abundances. Star #7 has been excluded. For each box, the central horizontal line is the median of the data, while the lower and upper lines indicate the first and third quartiles. The whiskers extend out to the maximum and minimum values of the data. Outliers are identified by small circles.
Current usage metrics show cumulative count of Article Views (full-text article views including HTML views, PDF and ePub downloads, according to the available data) and Abstracts Views on Vision4Press platform.
Data correspond to usage on the plateform after 2015. The current usage metrics is available 48-96 hours after online publication and is updated daily on week days.
Initial download of the metrics may take a while.