Fig. 5
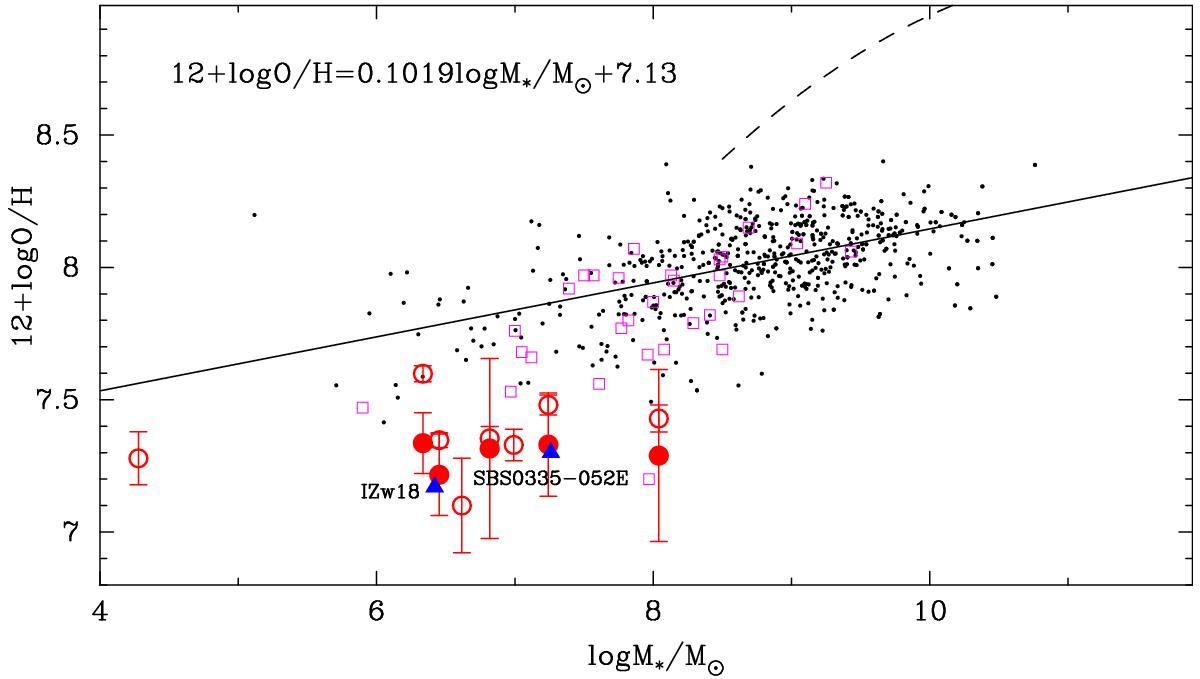
Stellar mass oxygen abundance relation. Emission-line XMD galaxies with 12 + log O/H < 7.35 and our XMD candidates are shown in red and blue. Symbols are the same as in Fig. 3. For comparison, the SDSS DR7 emission-line galaxy sample by Izotov et al. (2014a), where the errors in [O iii]λ4363 emission-line flux do not exceed 25%, are shown in black dots. The linear likelihood regression for this SDSS DR7 sample is plotted with a solid line. The small open squares in magenta are the data derived by Berg et al. (2012). The mass–metallicity relation obtained from 53 000 SDSS star-forming galaxies by Tremonti et al. (2004) is plotted with a dashed line.
Current usage metrics show cumulative count of Article Views (full-text article views including HTML views, PDF and ePub downloads, according to the available data) and Abstracts Views on Vision4Press platform.
Data correspond to usage on the plateform after 2015. The current usage metrics is available 48-96 hours after online publication and is updated daily on week days.
Initial download of the metrics may take a while.