Fig. 10
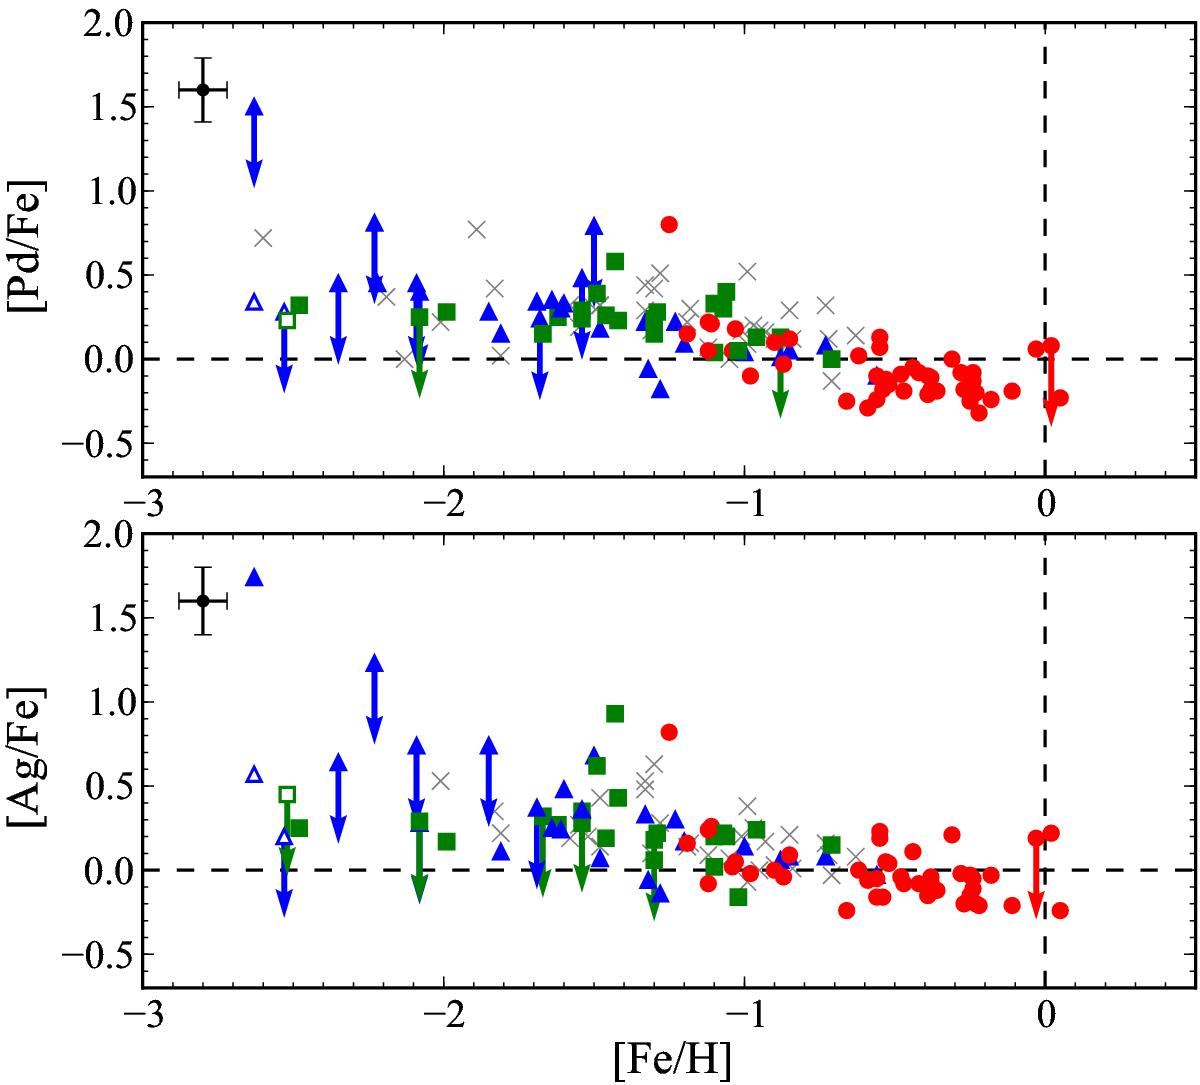
[Pd/Fe] (upper panel) and [Ag/Fe] (lower panel) vs. [Fe/H]. Red, green, and blue points represent thin disk, thick disk, and halo stars. Solid points denote dwarfs, while open circles denote the three giants in our sample. The arrows represent the lower or upper limits of the data points. The typical errors (see Sect. 5.1) are shown in the upper left corner of each panel. The dwarfs in Hansen et al. (2012) are also plotted as crosses in this figure.
Current usage metrics show cumulative count of Article Views (full-text article views including HTML views, PDF and ePub downloads, according to the available data) and Abstracts Views on Vision4Press platform.
Data correspond to usage on the plateform after 2015. The current usage metrics is available 48-96 hours after online publication and is updated daily on week days.
Initial download of the metrics may take a while.