Free Access
Fig. 9
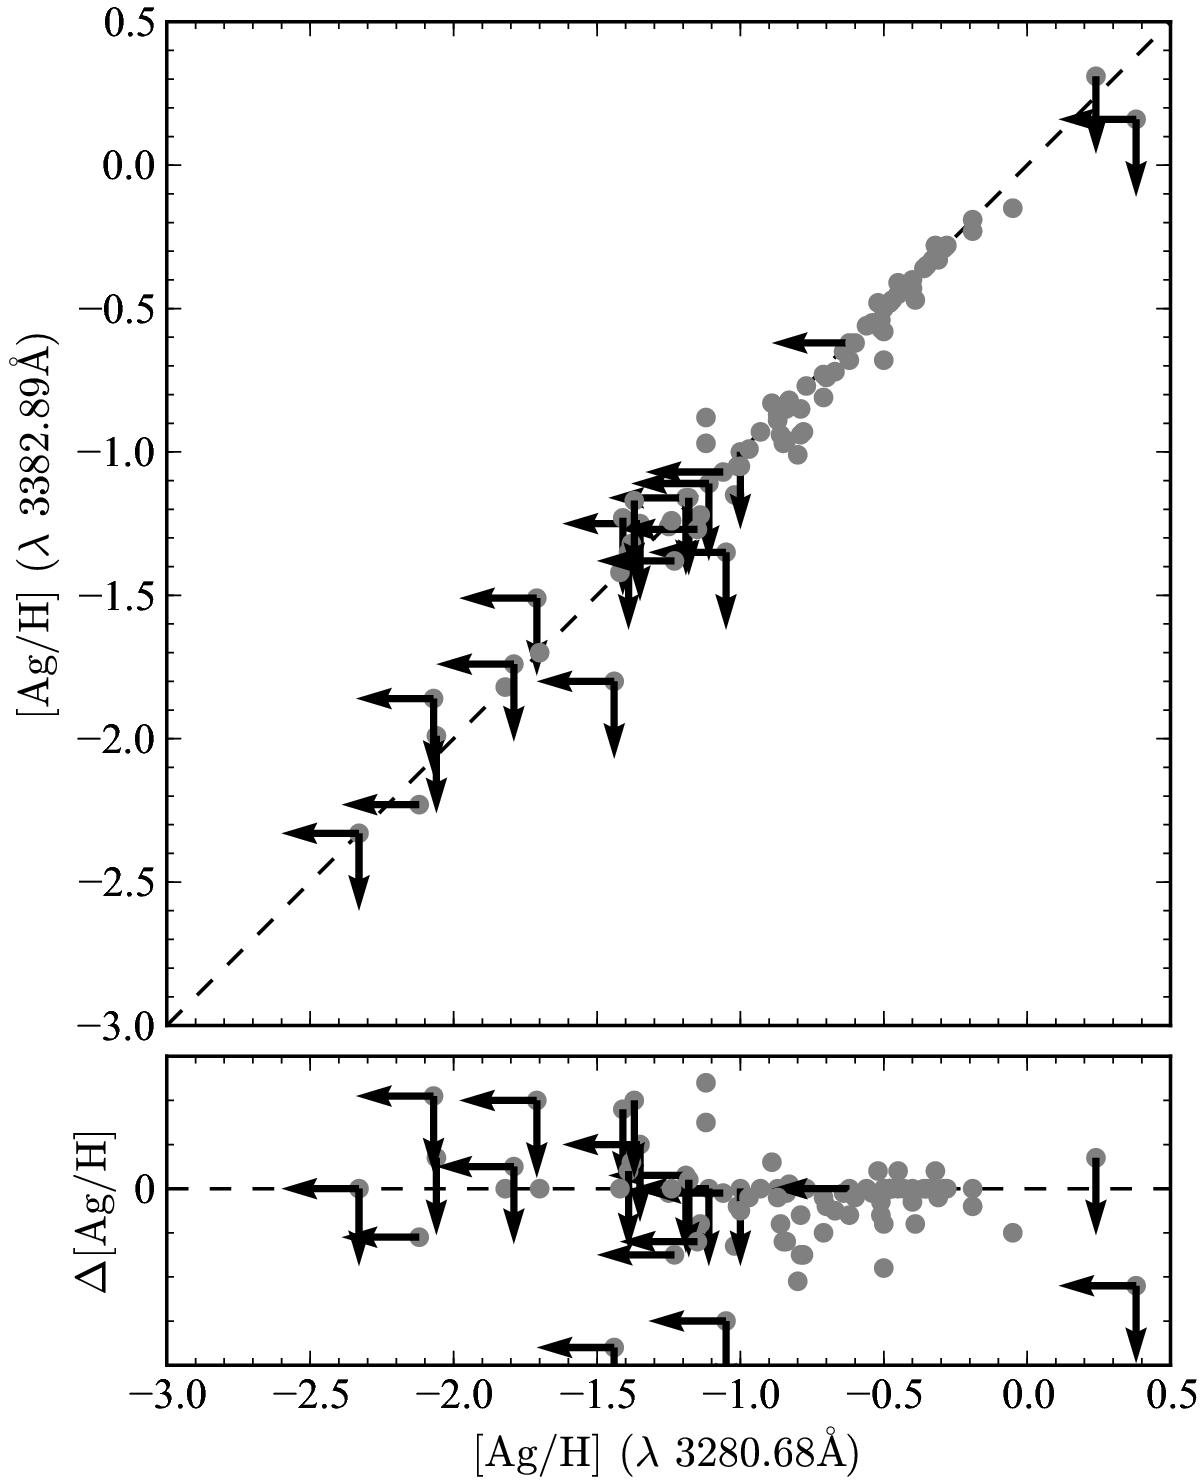
Comparison of abundance values derived from Ag i λ3280.68 Å and Ag i λ3382.89 Å. Arrows represent the upper or lower limits. The outlier with x = −2.01 and y = −0.7 is a spectroscopic binary G 88-10 (see discussions in section 6).
Current usage metrics show cumulative count of Article Views (full-text article views including HTML views, PDF and ePub downloads, according to the available data) and Abstracts Views on Vision4Press platform.
Data correspond to usage on the plateform after 2015. The current usage metrics is available 48-96 hours after online publication and is updated daily on week days.
Initial download of the metrics may take a while.