Fig. 8
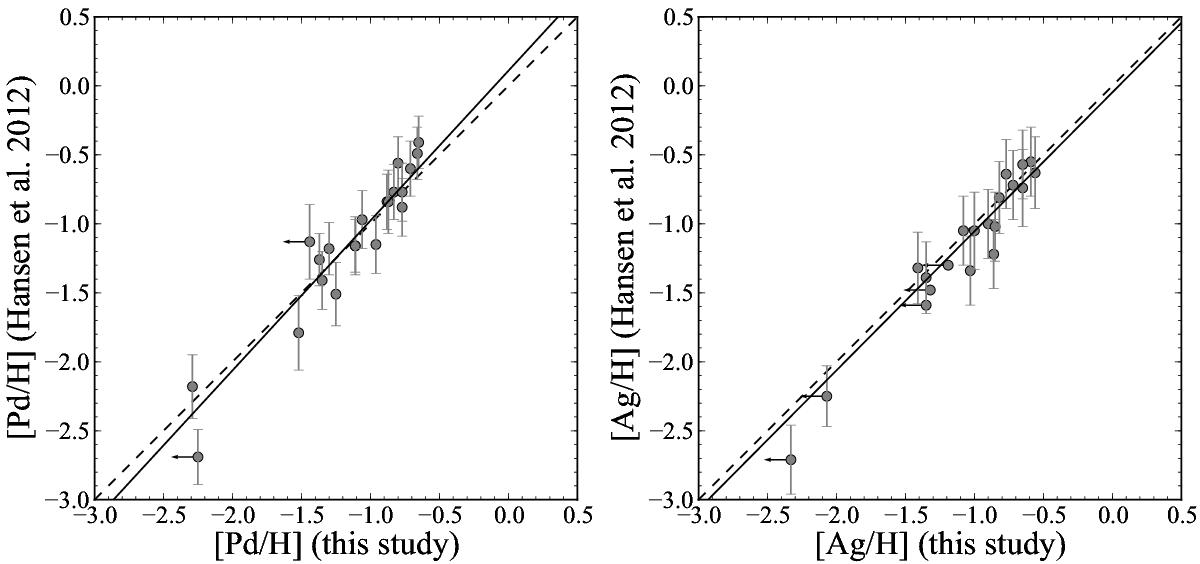
Comparison of Ag and Pd abundances of common stars in this study with those in Hansen et al. (2012). The dashed lines represent 1:1 ratios, and solid lines represent the linear least-square fitting functions y = (1.09 ± 0.09)x + (0.11 ± 0.10) for [Pd/H], and y = (1.01 ± 0.15)x + (−0.05 ± 0.14) for [Ag/H], where x denotes our abundances and y denotes those of Hansen et al. (2012).

Current usage metrics show cumulative count of Article Views (full-text article views including HTML views, PDF and ePub downloads, according to the available data) and Abstracts Views on Vision4Press platform.
Data correspond to usage on the plateform after 2015. The current usage metrics is available 48-96 hours after online publication and is updated daily on week days.
Initial download of the metrics may take a while.