Fig. 7
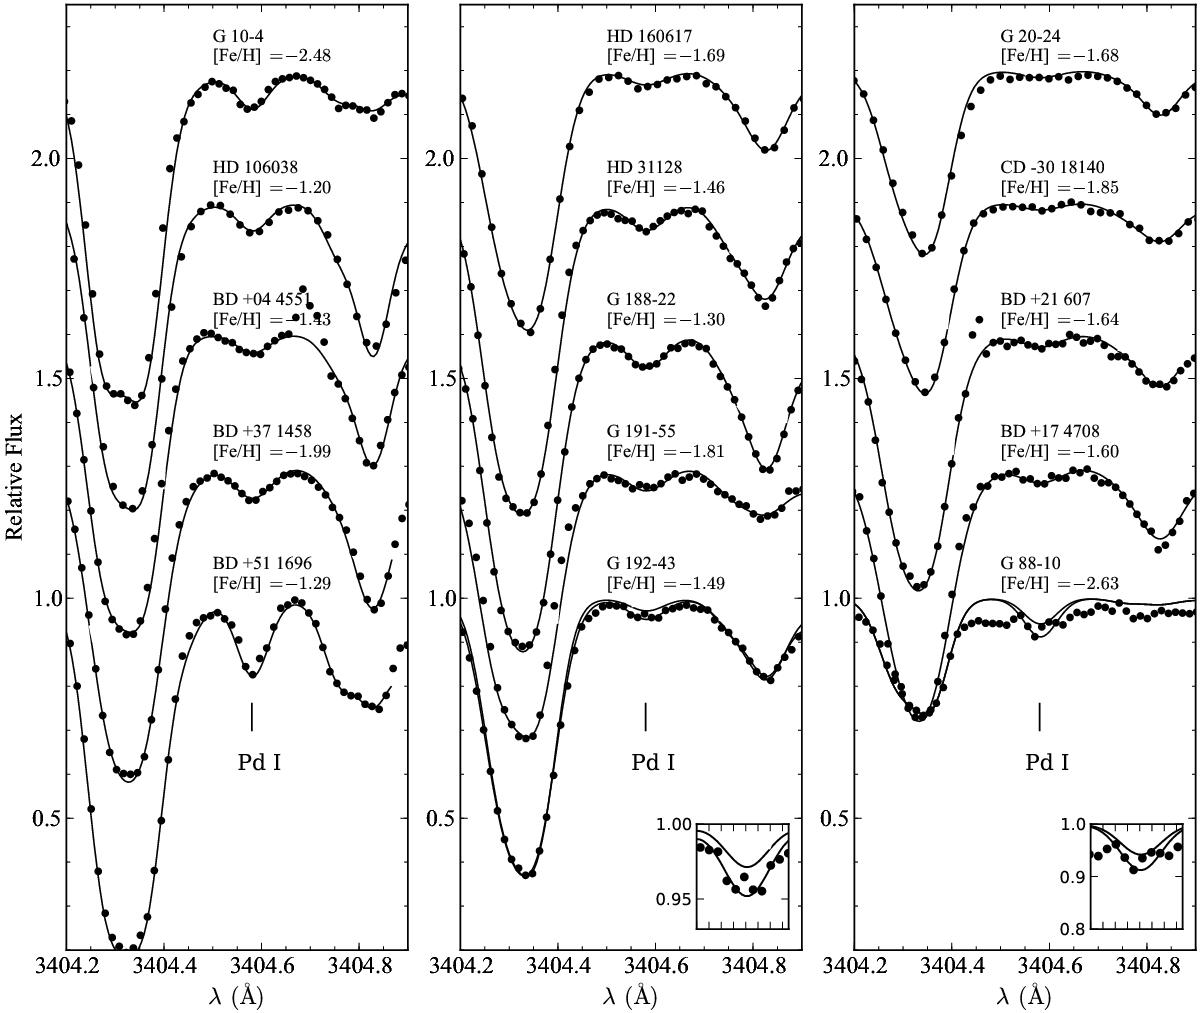
Examples of spectral synthesis around Pd i λ3404.9 Å used in this analysis. The dots represent the observational data and solid lines the synthesis spectra. Offsets of 0.3 were added for better visualization. See also Fig. 5 for details. For G 192-43, the absorption feature exhibits a W shape, as shown in the partial enlarged drawing of the spectrum in the lower right of the middle panel. Two synthesis spectra with [Pd/Fe] = 0.20 and 0.39 are overplotted, respectively. A similar plot is shown for G 88-10 (right panel), for which the lower synthesis ([Pd/Fe] = 1.50) was adopted as an upper limit.
Current usage metrics show cumulative count of Article Views (full-text article views including HTML views, PDF and ePub downloads, according to the available data) and Abstracts Views on Vision4Press platform.
Data correspond to usage on the plateform after 2015. The current usage metrics is available 48-96 hours after online publication and is updated daily on week days.
Initial download of the metrics may take a while.