Free Access
Fig. 3
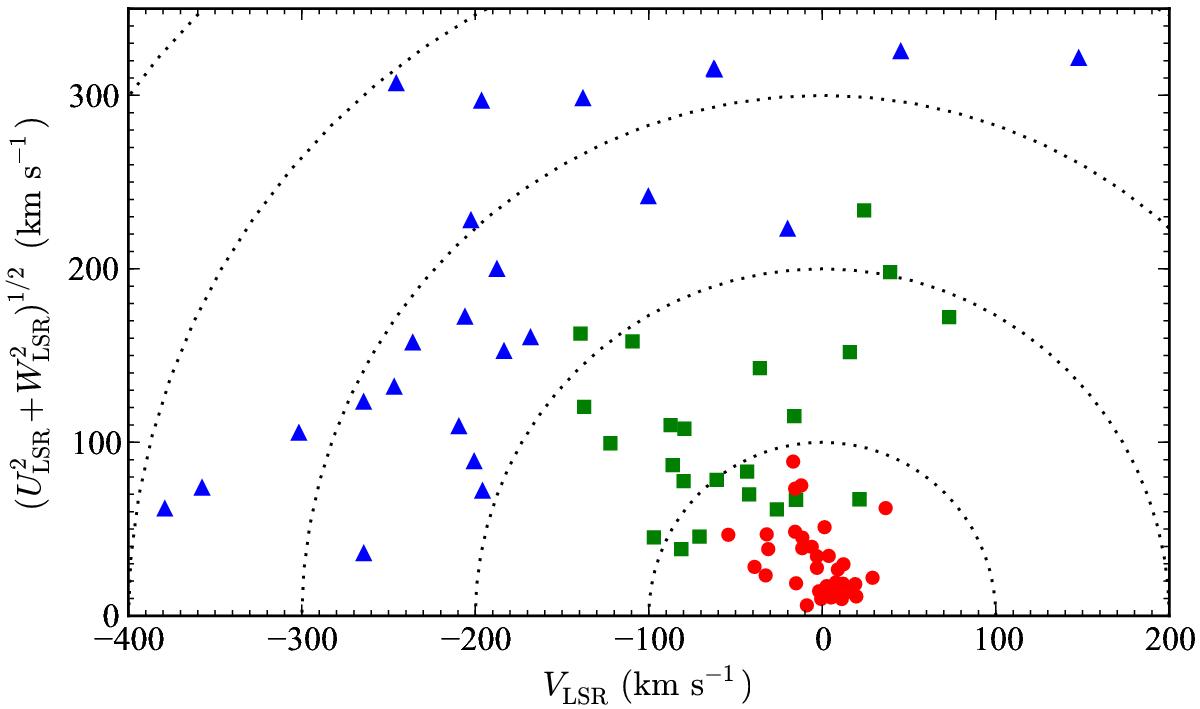
Toomre diagram of sample stars in this work. Stars with the highest probability of belonging to the thin disk, the thick disk, and the halo are plotted with red dots, green squares, and blue triangles, respectively. Dotted lines represent total velocities of ![]() in steps of 100 km s-1.
in steps of 100 km s-1.
Current usage metrics show cumulative count of Article Views (full-text article views including HTML views, PDF and ePub downloads, according to the available data) and Abstracts Views on Vision4Press platform.
Data correspond to usage on the plateform after 2015. The current usage metrics is available 48-96 hours after online publication and is updated daily on week days.
Initial download of the metrics may take a while.