Fig. 12
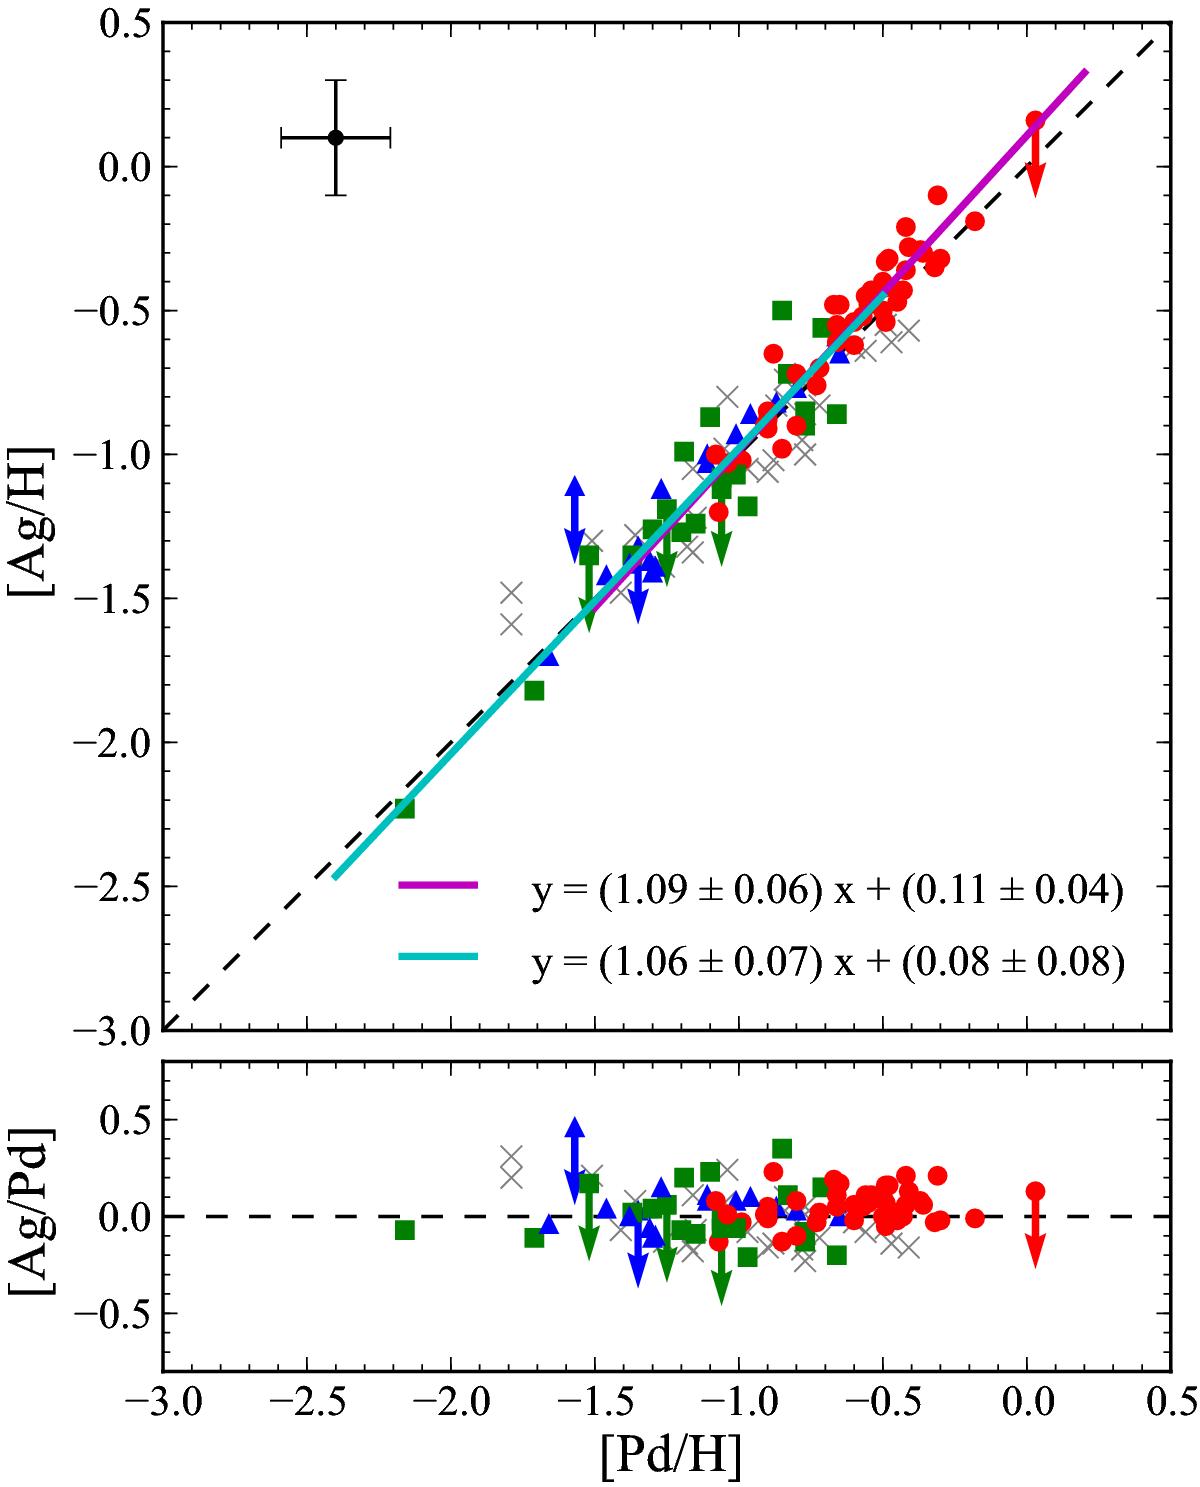
Relation of [Ag/H] versus [Pd/H] (upper panel) and [Ag/Pd] versus [Pd/H] (lower panel) for the dwarfs in our sample. Red, green, and blue dots denote the sample stars that classified as thin disk, thick disk, and halo components by their kinetic properties, respectively (see Sect. 4). The dashed line represents the 1:1 ratio, and the solid lines are the least-square linear fitting of the two subsamples of dwarfs (magenta: for thin disk stars; cyan: for thick disk + halo stars). The dwarfs in Hansen et al. (2012) are overplotted as crosses in this plot. The typical errors of Pd and Ag abundances are also shown in the upper left corner.
Current usage metrics show cumulative count of Article Views (full-text article views including HTML views, PDF and ePub downloads, according to the available data) and Abstracts Views on Vision4Press platform.
Data correspond to usage on the plateform after 2015. The current usage metrics is available 48-96 hours after online publication and is updated daily on week days.
Initial download of the metrics may take a while.