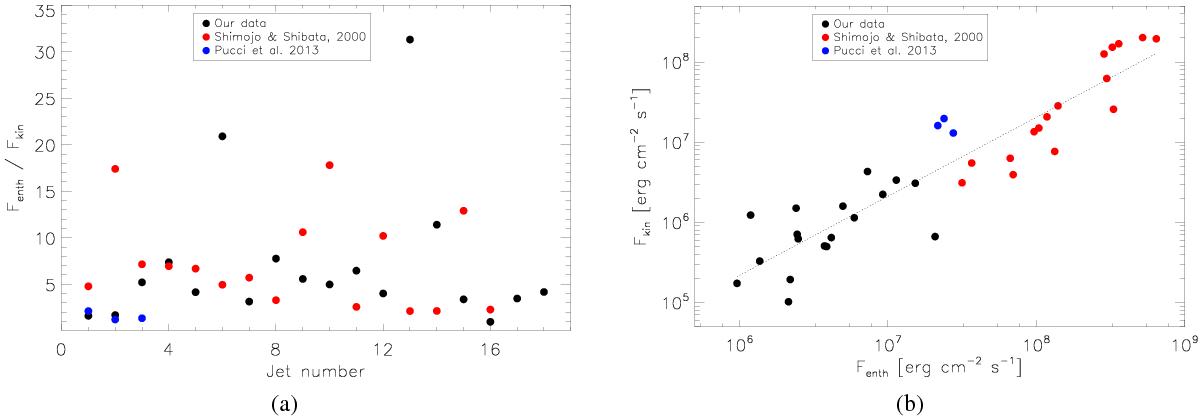
Fig. 7

Left panel a): ratio between the Fenth/Fkin fluxes (y-axis), computed for the 18 jets studied here (x-axis). Right panel b): enthalpy flux (on the x-axis, logarithmic scale) versus the kinetic flux (y-axis, logarithmic scale). Data from our analysis are plotted here (black circles), together with those (red and blue circles) from the studies performed by Shimojo & Shibata (2000) and Pucci et al. (2013).
Current usage metrics show cumulative count of Article Views (full-text article views including HTML views, PDF and ePub downloads, according to the available data) and Abstracts Views on Vision4Press platform.
Data correspond to usage on the plateform after 2015. The current usage metrics is available 48-96 hours after online publication and is updated daily on week days.
Initial download of the metrics may take a while.


