Fig. 5
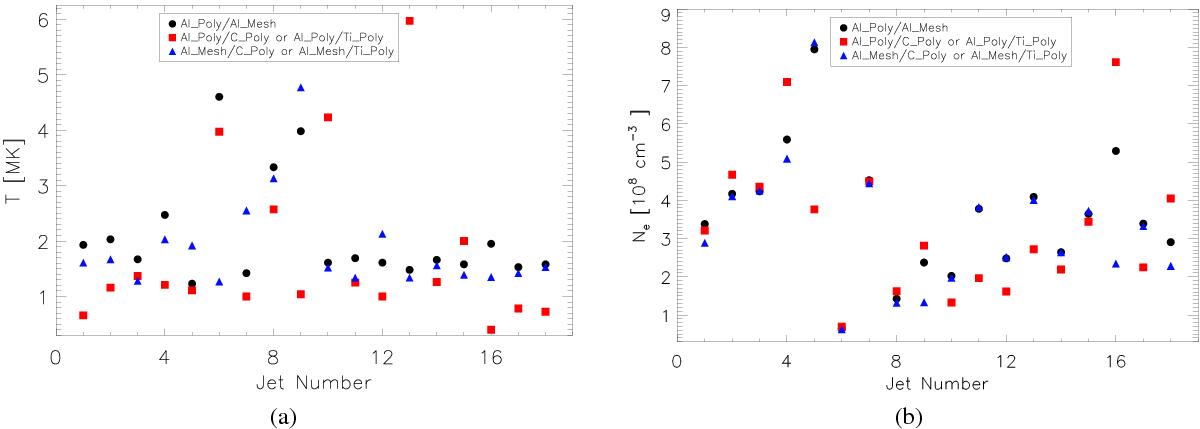
Jet parameters derived using the three filter ratio combinations. Left panel a): jet temperatures (y-axis) derived for the 18 jets studied here (x-axis) using different filter ratios. Right panel b): jet densities (y-axis) derived, using Eq. (6), for all events (x-axis) using different filter ratios. Different filter pairs are depicted using different symbols and colors (as shown in the legend). Computed values usually correspond closely between the Al_Poly/Al_Mesh, Al_Mesh/C_Poly, and Al_Mesh/Ti_Poly ratios, while values derived from the Al_Poly/C_Poly or Al_Poly/Ti_Poly ratio are somewhat different.
Current usage metrics show cumulative count of Article Views (full-text article views including HTML views, PDF and ePub downloads, according to the available data) and Abstracts Views on Vision4Press platform.
Data correspond to usage on the plateform after 2015. The current usage metrics is available 48-96 hours after online publication and is updated daily on week days.
Initial download of the metrics may take a while.