Fig. 3
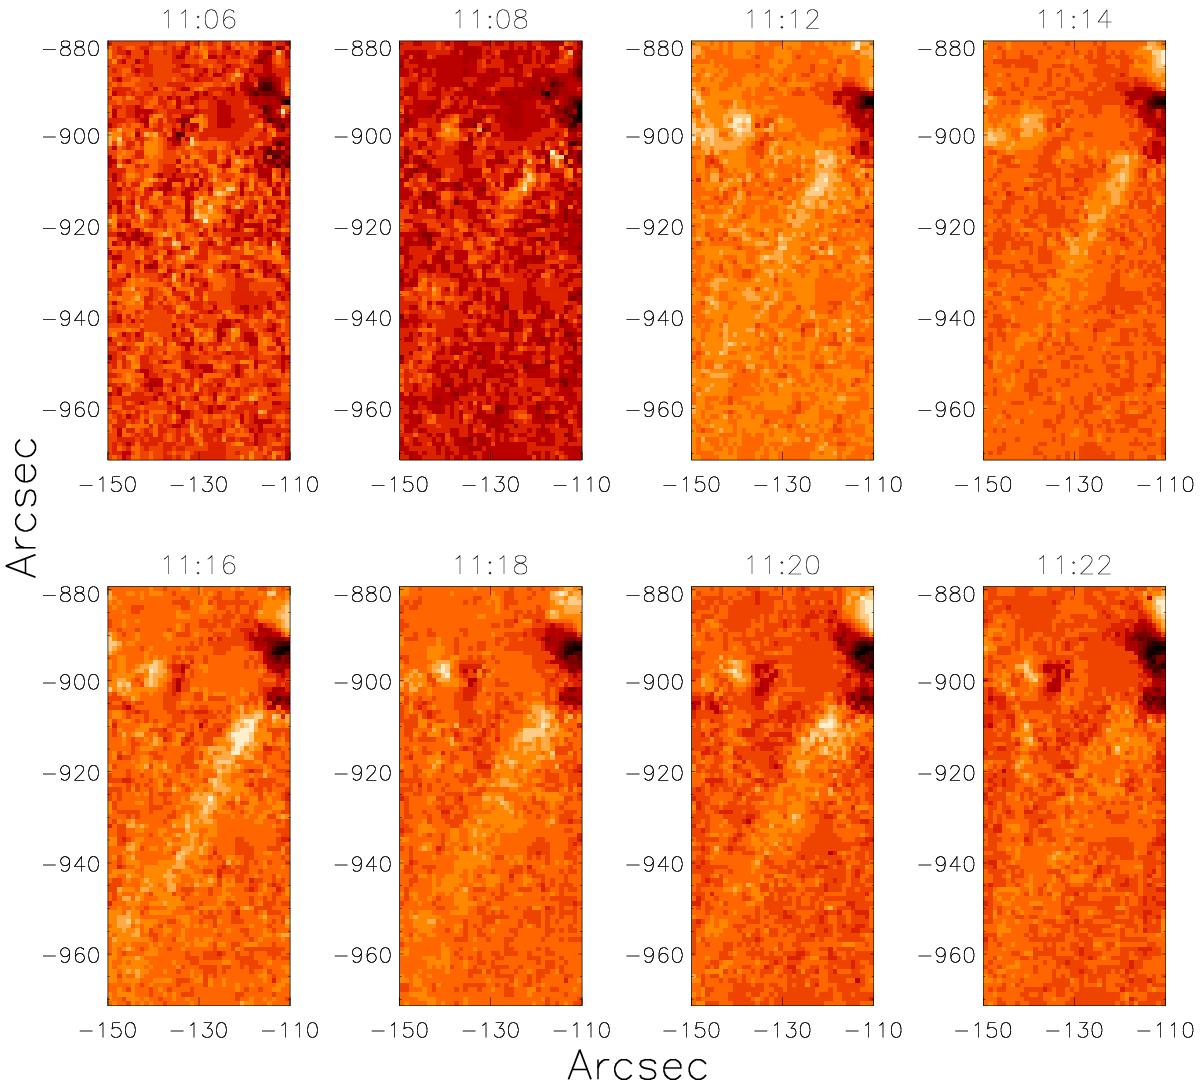
Example of jet eruption in a sequence of base difference images (prior to rotating the frame for analysis; see text) showing the rising phase, the main phase, and the decay phase of a jet event. The outflow speed can be computed by time tracking the leading edge of the eruption. This sequence was acquired between 11:06 UT and 11:26 UT on 26 Jan. 2009 with the Al_Poly filter.
Current usage metrics show cumulative count of Article Views (full-text article views including HTML views, PDF and ePub downloads, according to the available data) and Abstracts Views on Vision4Press platform.
Data correspond to usage on the plateform after 2015. The current usage metrics is available 48-96 hours after online publication and is updated daily on week days.
Initial download of the metrics may take a while.