Free Access
Fig. 1
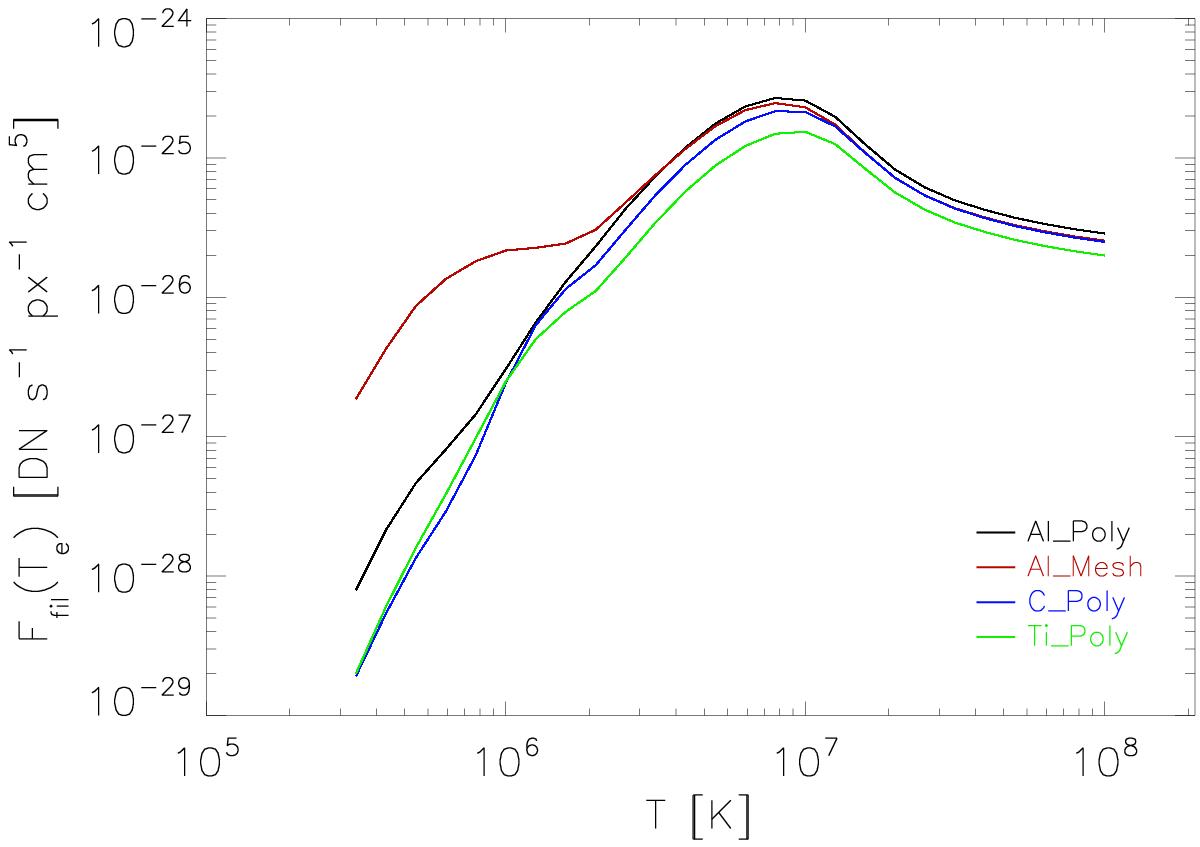
Total XRT temperature response, given for the X-ray focal-plane filters we used. Each curve plots the combination of the total instrument response as a function of wavelength, assuming a coronal plasma emission model (ATOMDB/APEC). The full filter response curves are available in Narukage et al. (2014).
Current usage metrics show cumulative count of Article Views (full-text article views including HTML views, PDF and ePub downloads, according to the available data) and Abstracts Views on Vision4Press platform.
Data correspond to usage on the plateform after 2015. The current usage metrics is available 48-96 hours after online publication and is updated daily on week days.
Initial download of the metrics may take a while.