Fig. 2
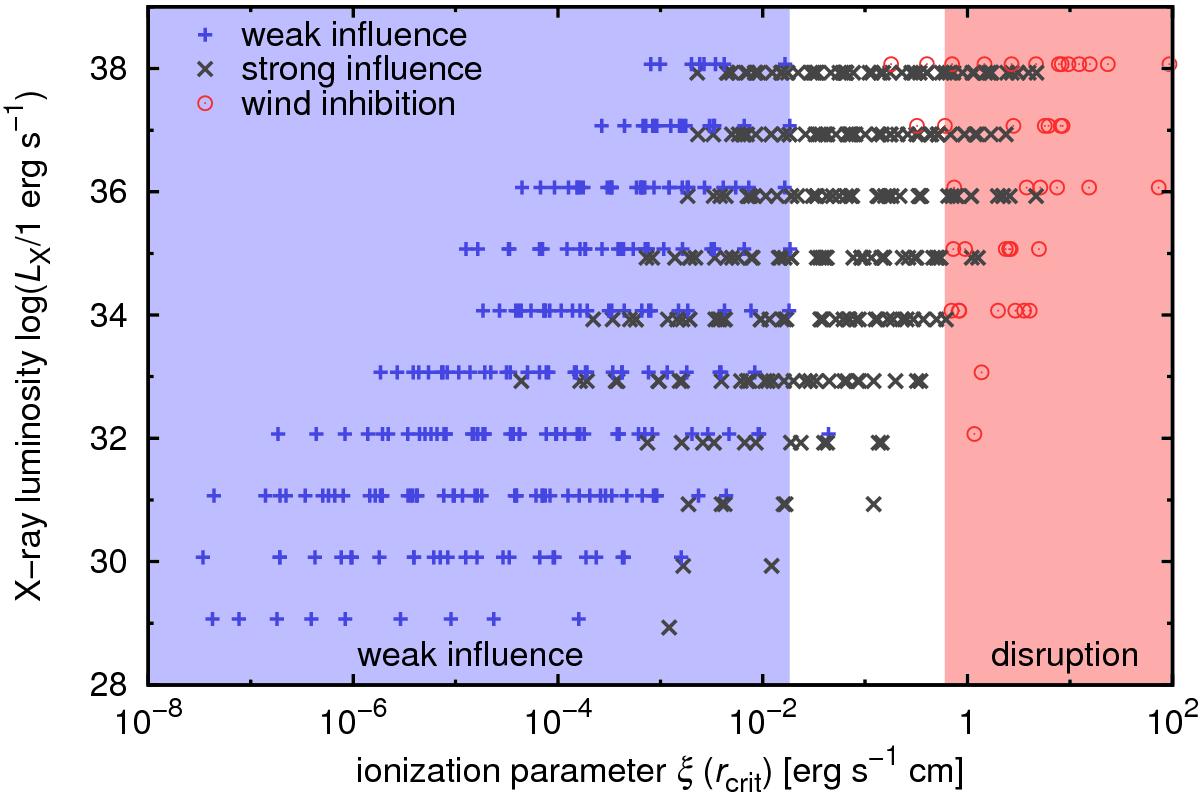
Parameters of all models from Fig. 1 plotted in the diagram of X-ray luminosity vs. the ionization parameter. The ionization parameter Eq. (5)was evaluated at the wind critical point with radius rcrit. The influence of X-rays is denoted using different symbols. Blue plus signs + denote the weak influence of X-rays (possibly just on the ionization equilibrium), grey crosses × denote the strong influence of X-rays leading to the decrease of the terminal velocity, and empty red circles ⊙ denote models with wind inhibition. The individual symbols are slightly vertically shifted for a better readability. The extension of individual regions is also denoted using coloured areas.
Current usage metrics show cumulative count of Article Views (full-text article views including HTML views, PDF and ePub downloads, according to the available data) and Abstracts Views on Vision4Press platform.
Data correspond to usage on the plateform after 2015. The current usage metrics is available 48-96 hours after online publication and is updated daily on week days.
Initial download of the metrics may take a while.